Live Cell Analysis of Fluorescent Co-Culture Assay
Measure % RFP Positive Cells in Samples Containing GFP, RFP and Non-Expressing Cells
A 96-well plate containing samples with varied % of RFP, GFP and non-expressing HeLa cells were counted using Celigo. Bright field, green fluorescence and red fluorescence channels were used.
Step 1. Acquire & View Images on Celigo Image Cytometer
View whole-well cell images
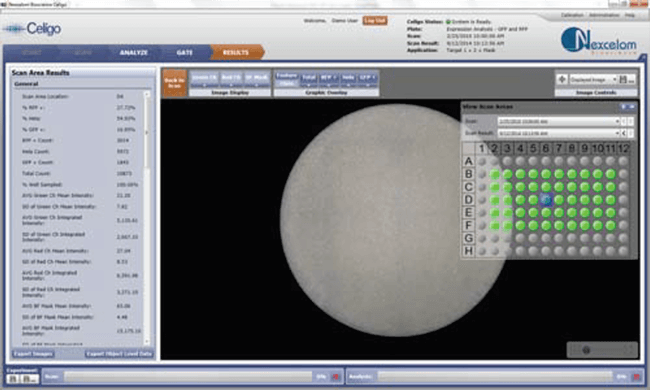
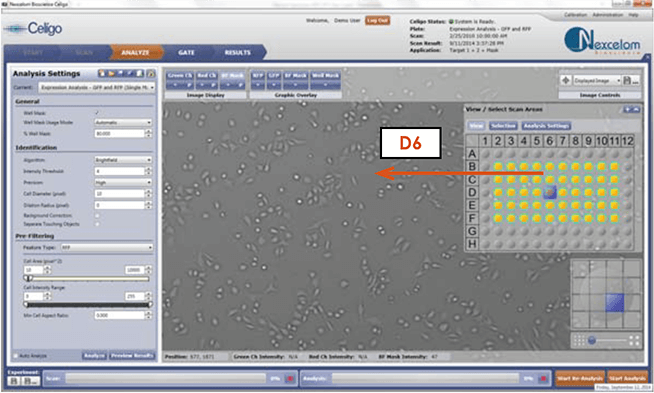
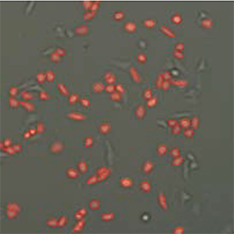
Double click any well on the well map to display whole-well images. Zoom in to see details as shown below in cell image examples.
Bright field image of well D6, zoomed view
RFP fluorescent image of well D6, zoomed view
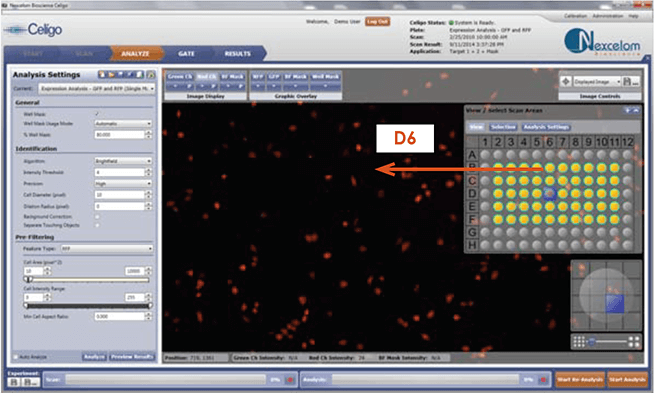
Cell image examples from wells with varied RFP+ cell populations
GFP+, RFP+
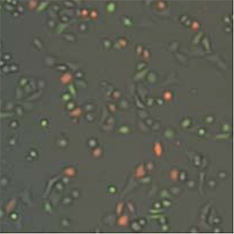
RFP+
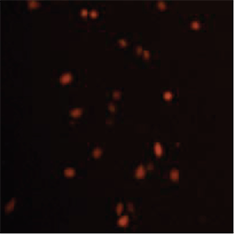
RFP fluorescent image of well D6, zoomed view
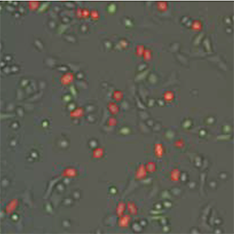
GFP+, RFP+
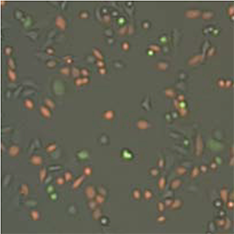
RFP+
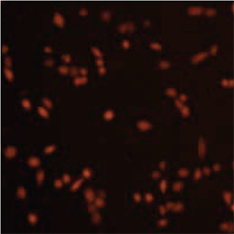
Counted RFP+
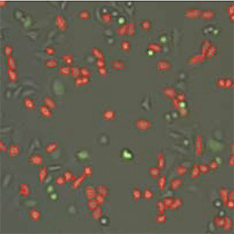
GFP-, RFP+
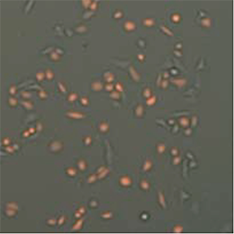
RFP+
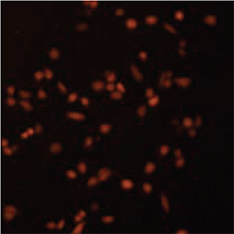
Counted RFP+
Step 2. Gate and Circle Counted Cells Automatically
Celigo gating and segmentation interface
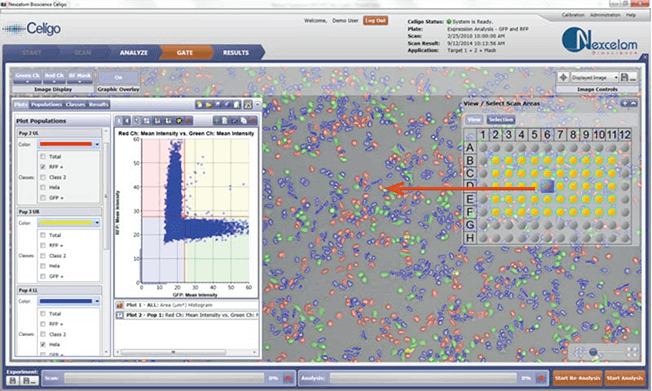
Overlay of bright field, GFP+ and RFP+ cells identified by Celigo image processing software. GFP vs RFP intensity scatter plot is also shown. When the gate on the scatter plot is modified by dragging, the counted cell image is updated automatically.
Example Plots
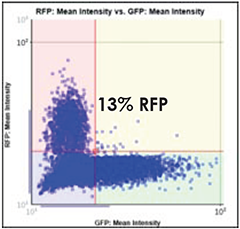
GFP vs. RFP Scatter Plot
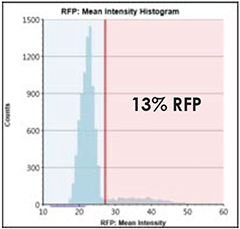
RFP Intensity Histogram
GFP vs. RFP Scatter Plot
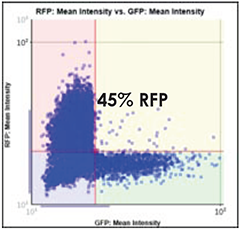
RFP Intensity Histogram

GFP vs. RFP Scatter Plot
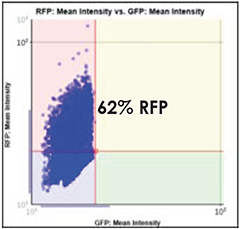
RFP Intensity Histogram
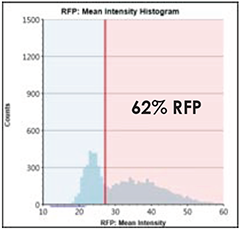
Step 3. Review Plate Level Results for Each of the Wells in the 96-Well Plate
Results are displayed in a plate-based format
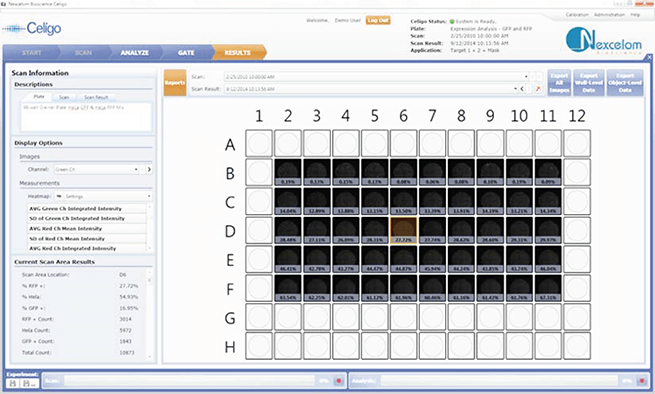
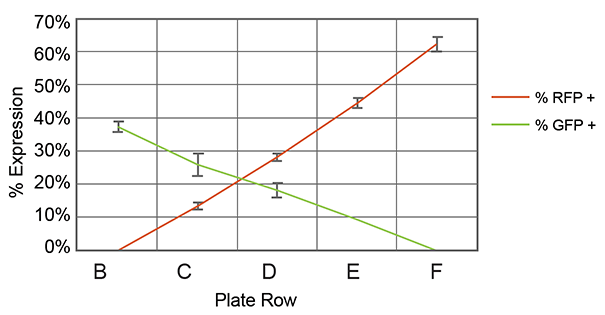
Step 4. Export Results for Each of the Wells in the 96-Well Plate and Produce Data Plot
Results exported in Excel
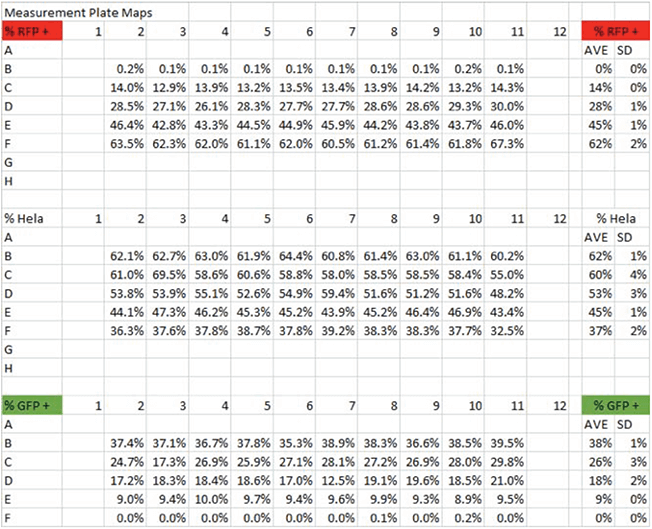
Percent Expression of Fluorescent Proteins
