CAR T Cell-Mediated Cytotoxicity
Directly Measure CAR T Cell-mediated Cytotoxicity using Direct Cell Counting in 96-well Plates
- Scan the same plate over multiple time points to directly monitor the killing of target cells.
- Perform whole-well imaging and analysis of an entire 96-well plate in under 15 minutes
- No need trypsinize the cells and then perform lengthy flow cytometry protocols. The Celigo directly counts and reports every remaining target cell in each well
Introduction to CAR T Cell-Mediated Cytotoxicity
The Chimeric antigen receptor (CAR-T) technology focuses on generating a genetically modified t-cells that can directly bind to, and attack cells of interest. The CAR-T cell is comprised of an antigen-specific binding domain that is fused to the genetically engineered activating motif. Once expressed on the cell surface the CAR-T-cell can then target and attack the specific targeted cells.
Protocol
- Target cells (either stably expressing GFP or labeled with a fluorescent dye) are seeded in the wells of microplates
- CAR-T cells were added to the wells at different Effector:Target (E:T) cell ratios
- Whole well images are acquired for each channel and the images are automatically analyzed to report the number of remaining GFP positive target cells
In-plate Live-cell Imaging and Quantification of CAR T Cell-Mediated Cytotoxicity
- GFP-HEK293 cells expressing HIV viral envelop protein were seeded in 96-well plate
- CAR-T cells were then added to each well at different effector : target (E:T) ratios
- Subsequently the plate was scanned at 0, 18, 22 and 42 hours post addition of effector cells
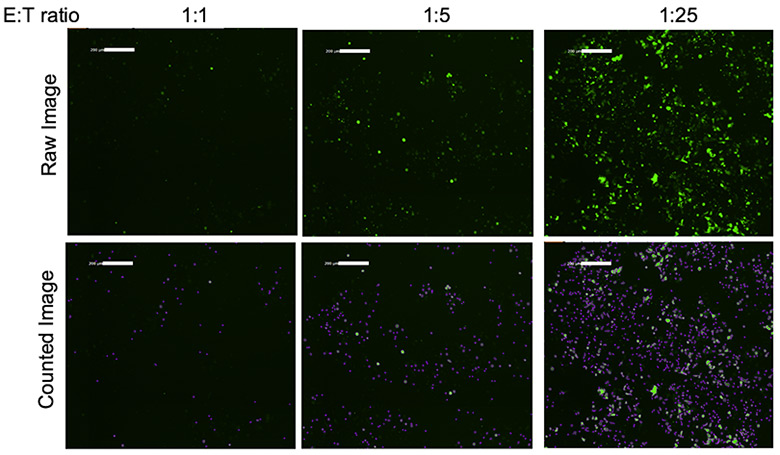
Fluorescent and counted images of target cells at different E:T ratios

The raw images on top show the GFP-HEK293 cells at different E:T ratios. The greatest number of surviving GFP-HEK293 cells are those that contained the fewest number of CAR-T effector cells. The bottom set of images shows GFP-HEK293 cells that were identified and outlined by the Celigo software
- Since the plate was first imaged at 0 hours, we were able to establish a baseline for the number of GFP-HEK293 positive cells in each well
- All data was then normalized to time 0 hours
CAR-T cell induced cytotoxicity / Untransduced PBMC

The y-axis is showing the fold change in the number of GFP positive HEK293 cells in comparison to 0-hour time point. The greatest CAR-T cell killing was observed after a 42 hour incubation period. The CAR-T cells were effective in killing the HIV expressing HEK293 cells at both 1:1 and 1:2 E:T ratio
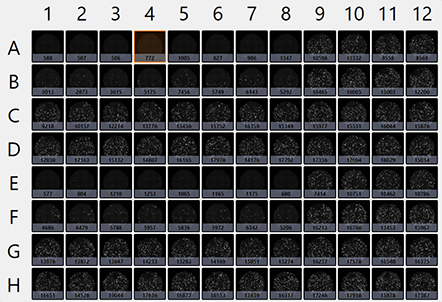
Celigo software shows and reports plate-level results: (42 hr time point)

The entire plate was scanned and analyzed in 10 minutes. The plate level view shows a thumbnail picture of the full well scan as well as the number of GFP positive cells the software identified and counted.

