
Automated Cell Counters, Image Cytometers, and Reagents
Tips for Choosing the Best Cell Counter Machine
As a leading supplier of some of the world’s best automatic cell counters, Nexcelom’s portfolio includes high-throughput, brightfield, fluorescent, and yeast automated cell counters, all equipped for accurate cell cycle analysis. Modules for 21 CFR Part 11 are also available for certain cell counters.
High-throughput Automated Cell Counters
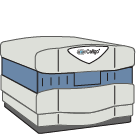
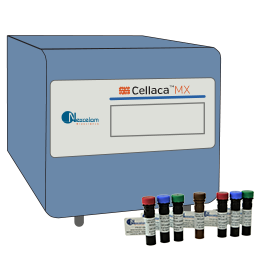
Nexcelom’s high-throughput cell counters are plate-based and feature brightfield and fluorescent imaging. Both the Celigo Image Cytometer and the Cellaca MX High-throughput Cell Counter are available in 21 CFR Part 11 modules.
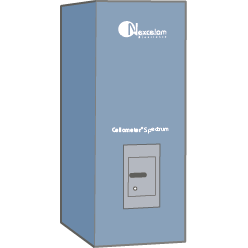
A micro-well, plate-based multichannel brightfield and florescent imaging cytometer for 2D and 3D culture using both adherent and suspension cells. 21 CFR Part 11 module is available.
The Cellaca PLX system with Matrix analysis software and dedicated reagents and consumables provides a benchtop solution for accurate measurements of small sample volumes to easily perform rapid subpopulation analysis for downstream processing.
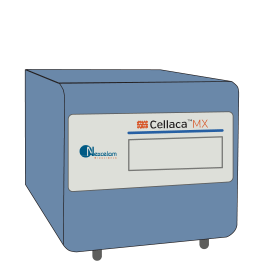
High-throughput cell counter with brightfield and two fluorescent channels. Counts 24 samples with fluorescence in 2.5 minutes or less using a plate-based format. 21 CFR Part 11 module is available.
Eliminating the need to perform RBC lysis, our fluorescent cell counters are some of the best automatic cell counters, having fixed single or dual fluorescent optics modules that allow researchers to use fluorescent stains to determine viability easily. With three options to choose from, our fluorescent automated cell counters vary in function.
Advanced, modular cell counter capable of running cell-based assays utilizing fluorescent reagents and kits. Customizable for specific assays/reagents of interest.

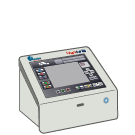
Advanced, dual-fluorescence cell counter with built-in assays and cell types for the analysis of hepatocytes, stem cells, splenocytes, tumor suspension, and other complex primary cells. 21 CFR Part 11 module is available.
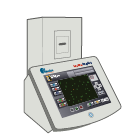
All-in-one touchscreen, dual-fluorescence cell counter optimized for analysis of primary cells from peripheral blood, cord blood, bone marrow, and other complex samples. Features preconfigured one-touch assays for a variety of samples.
Nexcelom brightfield automated cell counters range in function and capabilities. Each of these cell counters accurately and easily performs cell count, concentration, and Trypan Blue viability measurements on cultured cell lines and purified primary cell samples in less than 30 seconds.

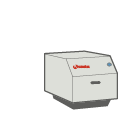
Automated cell counter for concentration and trypan blue cell viability of cell lines, even clumpy cells, with optional GMP/GLP software.
This product is no longer manufactured. Support information for this product can still be found by clicking here.
There is limited availability of this product. Support information for this product can still be found by clicking here.
Our yeast automated cell counter, the Cellometer X2, has proven to be five times faster than manual cell counting. The cell count, concentration, diameter, and % viability are automatically calculated and reported within less than 60 seconds, proving to be one of the best automatic cell counter machines on the market.
The Cellometer X2 is optimized for live yeast cell concentration and viability counting, including for:
- Brewing yeast
- Wine yeast
- Platelets
- Other small cells
Optimized for brewing yeast, wine yeast, platelets and other small cells.
Consumables
Nexcelom Bioscience offers a wide range of fluorescent reagents and kits for cell counting, cell viability, and cell-based assays. Our reagents are optimized to work with Cellometer and Celigo imaging systems as well as other fluorescence-based instruments.
Nexcelom Bioscience offers a wide range of brightfield and fluorescent bead products designed for quick and simple QC tests of cell counting instruments.
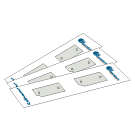
All-plastic, disposable Cellometer cell counting slides and low-fluorescence Cellaca PLX imaging slides.
Nexcelom’s disposable hemocytometer is an enclosed chamber with two ports for sample introduction. The hemocytometer’s counting grid pattern is the improved Neubauer. There are two counting chambers per slide for replicates.
All-plastic, disposable counti
If you need sub-cellular resolution, check out Operetta® CLS ™ and Opera Phenix ® Plus high-content screening systems.