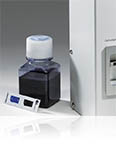
Cellometer Vision CBA Image Cytometer
Note: Effective June 2020 the Vision CBA Image Cytometer has been discontinued. The Spectrum Image Cytometer is the recommended replacement for those looking for the same functionality as the Vision family of instruments.
Why Vision CBA?
- Simple, 20 µl Cell-Based Assays
- Nucleated Cell Counting & Viability without Lysing
- User-Changeable Fluorescence Optics Modules
“The Cellometer Vision CBA is user-friendly, making it easy to understand the software and it delivers fast results!”
“The Cellometer Vision CBA Image Cytometer is a great machine! It gives very precise results in a very short time, and only uses a small amount of sample, which makes it very efficient for research purposes.”
“The ease at which I can count bone marrow samples without Red Cell Lysis buffer to get total nucleated cell counts quickly and accurately with the Cellometer Vision CBA has allowed our research to expand drastically!”

Our customers include:

Introduction to the Cellometer Vision CBA Image Cytometer
Simple, 20µl Cell-Based Assays
The Vision CBA System combines the simplicity of image cytometry with the power of flow analysis software to offer user-friendly cell-based assays, featuring:
- Validated assay kits and reagents
- Simple staining and analysis procedures
- Default settings for automated data generation
- No washing. No clogging. No daily calibration.
Growing Menu of Fluorescent Cell-Based Assays
- Apoptosis (Annexin V-FITC / PI)
- Apoptosis (Caspase Activity)
- Autophagy (CytoID-green)
- Cell Proliferation (CFSE)
- Cell Cycle (PI)
- GFP, RFP, YFP Transfection
- Mitochondrial Potential / Early Cell Death (JC-1)
- Multi-Drug Resistance (ABC Transporter)
- Surface Marker Analysis (PE, APC, FITC)
- Viability (AO/PI, Trypan blue)
- Vitality (Calcein-AM / PI)
Flow-Like Data Output
Vision CBA and FCS Express Software enable automated data output to pre-set data layouts for individual cell-based assays. Users have the option to modify the automatic gating with instant visual display and data update.
- Cell Images
- Data Tables
- Dot Plots
- Histograms
Data layouts can be modified to accommodate multi-sample analysis and create customized analysis and / or quality control reports.
Nucleated Cell Counting and Viability in <60 Seconds
Count Live Nucleated Cells
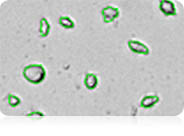
Fluorescent dyes that stain DNA can be used to identify nucleated cells in a mixed cell population. Acridine orange (AO) is a nuclear staining (nucleic acid binding) dye permeable to both live and dead cells. It stains all nucleated cells to generate green fluorescence.
Live cells stained with AO
Count Dead Nucleated Cells
Fluorescent membrane-exclusion dyes that stain DNA can be used to identify dead nucleated cells in a mixed cell population. Propidiom iodide (PI) is a nuclear staining dye that can only enter cells with compromised membranes. Healthy cells exclude the dye. Dead nucleated cells stained with both AO and PI fluoresce red due to fluorescence resonance energy transfer.
Dead cells stained with PI
No Interference from RBCs, Platelets, or Debris
Because platelets and mature mammalian red blood cells don’t contain nuclei, only mononuclear cells produce a fluorescent signal. Fluorescent-positive live and dead nucleated cells are easily counted and red blood cells are excluded from cell counts. There is no need to lyse red blood cells, saving time and eliminating an extra sample preparation step. This also allows technicians to use a single viability method for analysis of both fresh and processed blood, bone marrow, and digested tissue samples.
Red blood cells seen in the bright field image (red arrows, left image) are not visible in the fluorescent image on the right. Red blood cells are excluded from cell counts.
User-Changeable Fluorescence Optics Modules
The Vision CBA Image Cytometry System features two user-changeable fluorescence optics modules. The robust modules are easily removed and replaced. Available modules cover a spectrum from UV to far-red, enabling analysis of a wide range of fluorescent proteins, dyes, and fluorophores.
| Optics Module | Fluorophores | Nucleic Acid Stains | Fluorescent Proteins |
|---|---|---|---|
| VB-450-302 Ex: 375 nm Em: 450 nm |
AlexaFluor® 350 | DAPI Hoechst 33342 Hoechst 33258 |
BFP CFP |
| VB-535-402 Ex: 475 nm Em: 535 nm |
Calcein FITC AlexaFluor® 488 |
AO (acridine orange, +DNA) SYTO®9, SYTO®13 |
GFP YFP |
| VB-595-502 Ex: 525 nm Em: 595 nm |
AlexaFluor® 546 AlexaFluor® 555, Cy3® PE (R-phycoerythrin) Rhodamine B |
PI (propidium iodide) EB (ethidium bromide) SYTOX® Orange |
RFP Ds Red TdTomato |
| VB-660-503 Ex: 540 nm Em: 660 nm |
AlexaFluor® 647 7-AAD Nile Red |
PI (propidium iodide) EB (ethidium bromide) AO (acridine orange, +RNA) |
|
| VB-695-602 Ex: 630 nm Em: 695 nm |
AlexaFluor® 647, Cy5® APC (allophycocyanin) |
SYTOX® Red | Crimson |
*This table is a partial list of compatible fluorophores, nucleic acid stains, and fluorescent proteins. Please contact Nexcelom technical support regarding compatibility of other reagents.
Sytox, AlexaFluor, and Cy are trademarks of Life Technologies
Trypan Blue Viability
In addition to dual-fluorescence viability, the Vision includes a default assay for cell concentration and % viability for cultured cells stained with trypan blue.
Trypan blue viability is a dye exclusion method that utilizes membrane integrity to identify dead cells. The dye is unable to penetrate healthy cells, so they remain unstained. Dead cells have a compromised cell membrane that is permeable to the trypan blue dye. Dead cells are stained blue and display as dark cells in the Cellometer software with bright field imaging.
Other bright field stains, such as Methylene Blue and Erythrosine B, can also be analyzed using Cellometer cell counters.
Counted Trypan Blue Bright Field Image
Counted Erythrosin B Bright Field Image
Live cells are circled in green. Dead cells are circled in red.
![]()
Within 30 seconds, the Vision instrument reports:
- Cell concentration (total, live, and dead)
- Cell number (total, live, and dead)
- Mean cell diameter (total, live, and dead)
- Percent viability
Hepatocyte Analysis
Primary hepatocytes (both fresh and cryo-preserved) are routinely used to test potential drug candidates for toxicity. Seeding with identical numbers of viable cells is important for accurate toxicity experiments. Due to their variable morphology and tendency to clump, hepatocytes can be difficult to count manually or with other automated cell counters. The Cellometer Vision features specialized algorithms for accurate counting of hepatocytes. Dual-staining with AO/PI enables counting of live and dead hepatocytes for automated viability determination.
Bright field image (left) shows the variable morphology of primary hepatocytes. Dual fluorescence image (right) shows counted live cells (circled in green) and counted dead cells (circled in red).
Simple Imaging Method Ideal for Fragile Cells
Hepatocytes are quite fragile. Because the Vision images cells directly from the counting chamber, the shear stress present in flow-based systems (where cells travel through the instrument) is eliminated.
Fast Analysis for Accurate Viability Determination
Because hepatocytes lose viability over time, it is important to complete the analysis very quickly. Staining with the Cellometer AO/PI viability reagent and loading of the counting chamber takes just 1 minute. Analysis with the Cellometer Vision is completed in less than 60 seconds.
Yeast Viability for BioFuel Production with Vision 10x
The Cellometer Vision (10x) Image Cytometry System is optimized for simple, 1-step determination of yeast concentration and viability in messy samples. Fluorescent nuclear staining dyes are used to stain live and dead nucleated cells. Learn more about the AO/PI dual-fluorescence method.
The Cellometer Yeast Viability Kit was specifically developed for dual-fluorescence analysis of yeast in samples containing corn mash. Reagents for viability of yeast in samples containing corn stover, sugar cane, and biomass are also available. Contact Nexcelom technical support for more information.
Bright field and fluorescent images of yeast from corn mash. Debris visible in the bright field image (above left) is excluded in the dual-fluorescence image (above right). Only live (circled in green) and dead (circled in red) yeast are counted.
Analysis of Clumpy and Irregular-Shaped Cells
Irregular-shaped Cells
The Cellometer cell roundness setting can be adjusted for recognition and counting of irregular-shaped cells, such as RD cells, activated T-cells, and hepatocytes.
- More than 1,600 different cell lines have been successfully counted using Cellometer Systems including the NCI-60 human cancer cell lines developed by the National Cancer Institute.
Clumpy Cells
The MCF-7 breast cancer cell line can be very clumpy. The Cellometer pattern-recognition software identifies and counts individual cells within these cell clumps for accurate analysis (shown at right).
For clumpy cells with poorly-defined edges, the Vision offers fluorescent counting. Cells can be stained with a nuclear dye, such as acridine orange (AO), then imaged and counted in the fluorescent channel.
Adipocyte Analysis
Nexcelom has designed specialized (PD-300) counting chambers to accommodate large cells, including adipocytes. The controlled chamber depth eliminates potential problems caused by the buoyancy of adipocytes. Imaging directly from the counting chamber eliminates the shear stress present in flow-based systems where cells travel through the instrument, making accurate analysis of fragile adipocytes possible.
Optimized bright field counting parameters or fluorescent stains can be used to exclude free lipid droplets (shown left) from counting results. Optimized settings for adipocyte analysis are saved as a unique cell type
Bright field image of adipocytes
Bright field counted image of adipocytes
Dual fluorescence live / dead counted image of adipocytes
Exclusion of Debris & Size-Based Counting
Because Cellometer recognizes cells based on size, brightness, and morphology, cellular debris is easily and accurately excluded from counting results.
- Cell size parameters can be modified to optimize exclusion of debris from results and enhance the accuracy of counting for a wide range of cell sizes.
- A fluorescent nuclear dye, such as acridine orange, can be used to more easily identify nucleated cells in samples containing debris.
Cell Size Histogram
The Cellometer Vision automatically generates a cell size histogram based on cell diameter.
Adipocyte cell size histogram showing variation in cell diameter from 44 to 202 microns.
Size-Based Counting
Minimum and maximum cell diameter settings in the Cellometer software can be optimized to count specific cells in a sample. The example below demonstrates counting of mature dendritic cells cultured from PBMCs based on cell diameter.
View, Print, and Save Cell Images and Data Tables
Bright field and fluorescent counted images of macrophages stained with Calcein-AM for detection of metabolically-active cells. Debris and dead cells in the bright field image (left) are not visible in the fluorescent image (right).
View Bright Field Images to check cell morphology.
View Fluorescent Counted Images to:
- confirm exclusion of debris
- confirm exclusion of unwanted cell types
- optimize counting of irregular-shaped cells
- confirm counting of individual cells within clumps
Automatically Save raw images and data to a secure network location.

Export Data to Excel.
Capture Colorized Images with screen-capture software for use in publications and presentations.

Print images and custom data reports directly from Cellometer software and FCS Express.
Counting Chambers: No Washing or Contamination
Cellometer Disposable Counting Chambers consist of two independent enclosed chambers with a precisely controlled height. Cell suspension of 20 microliters is loaded into the chamber using a standard single channel pipette.
The chamber is inserted into the Cellometer cell counter and the cells are imaged directly from the chamber. This simple sample loading and analysis method is ideal for fragile cells.
The disposable Cellometer Cell Counting Chambers offer several key advantages:
- Time savings – no washing
- No risk of cross-contamination
- Reduced biohazard risk to users
- Controlled sample volume
- Controlled chamber depth
- Direct imaging from chamber
- Most affordable automated counting consumables
Dedicated On-line and On-site Applications Support
![]()
On-site demonstrations allow users to evaluate a critical cell type or cell-based assay prior to making a purchase.
![]()
Technical seminars are a great way to introduce Cellometer cell viability and cell-based assays to multiple users within a lab or organization.
![]()
Free on-site installation and training are available to all Vision and Vision CBA customers.
![]()
Web-based support sessions are available to all Cellometer customers at no cost. Nexcelom technical support specialists can assist with creation of new cell types, optimization of counting parameters, and analysis of cell-based assays.
![]()
Comprehensive Protocols for a growing menu of cell-based assays assist with sample preparation, imaging, and data analysis. Detailed, step-by-step instructions with screen shots enable new users to run Cellometer kits for cell cycle, apoptosis, cell viability, and other assays.
![]()
On-Line Help can be accessed directly from the Vision and Vision CBA Instruments. Users can:
- View training videos
- View frequently asked questions
- Download instructions and software updates
- Submit a Support Ticket directly to Nexcelom
Cellometer Vision vs. Vision CBA: Which System is Right for Me?
The Cellometer Vision and Vision CBA are specifically optimized for concentration and viability analysis of complex cell samples and unique sample types. Unlike the standard Cellometer Vision, the Vision CBA features an additional light source (HSL Module) for enhanced sensitivity and FCS Express 4 Flow software for advanced population analysis based on fluorescence intensity. Assay data is displayed in a table and also as a scatter plot or histogram for simple identification and measurement of unique cell populations. The table below compares Vision and Vision CBA capabilities for a number of popular cell types and cell-based assays.
| Application or Cell-Based Assays | Cellometer Vision | Cellometer Vision CBA |
|---|---|---|
| Live/Dead Cell Concentration & Trypan Blue Viability (clean cell samples) | X | X |
| Live/Dead Nucleated Cell Concentration & Dual-Fluorescence Viability (samples with and without debris, RBC, platelets; no lysing) | X | X |
| Small Cells: Yeast, Algae, Platelets | 10x | 10x |
| Hepatocyte and Adipocyte Analysis | X | X |
| Cell Cycle: PI | X | |
| Apoptosis: Annexin V-FITC/PI, Caspases, Mitochondrial Membrane Potential | X | X |
| Autophagy | X | X |
| GFP, RFP, YFP, and other fluorescent proteins* | X | X |
| Surface Markers: FITC*, PE*, APC* | X | |
| Proliferation: CFSE* | X | |
| Apoptosis: Chromatin Condensation* | X |
X = numbers only X = with population plots and histograms
*Enhanced sensitivity of Vision CBA is strongly recommended for this application
*Enhanced sensitivity of Vision CBA may be required if signal is weak
Cellometer Vision Accessories
Cellometer Vision / Vision CBA Fluorescence Optics Modules
User-changeable fluorescence optics modules compatible with the Cellometer Vision and Vision CBA Systems
| Catalog # | Description | Compatible Dyes / Fluorophores* | Unit |
|---|---|---|---|
| VB-450-302 | Cellometer Vision Optical Module Excitation / Emission: 375nm/450nm |
DAPI, Hoechst 33342 and 33258, BFP, CFP | each |
| VB-535-402 | Cellometer Vision Optical Module Excitation / Emission: 475nm/535nm |
Acridine Orange (AO) (+DNA), Fluorescein (FITC), SYTO®9, SYTO®13, Calcein, Fluorescein (FITC), AlexaFluor®488, GFP, YFP | each |
| VB-595-502 | Cellometer Vision Optical Module Excitation / Emission: 525nm/595nm |
Propidium Iodide (PI),Ethidium Bromide (EB), SYTOX® Orange, AlexaFluor®546, AlexaFluor®555, Cy3®, R-phycoerythrin (PE), Rhodamine B, Ds Red, RFP, TdTomato | each |
| VB-660-502 | Cellometer Vision Optical Module Excitation / Emission: 540nm/660nm |
Propidium Iodide (PI),Ethidium Bromide (EB), Acridine Orange (AO) (+RNA), AlexaFluor®647, 7-AAD, Nile Red | each |
| VB-695-602 | Cellometer Vision Optical Module Excitation / Emission: 630nm/695nm |
Allophycocyanin (APC), AlexaFluor®647, Cy5®, SYTOX® Red, Crimson | each |
*An incomplete listing of popular fluorophores, dyes, and fluorescent proteins that are compatible.Customized optical modules in the UV to far-red range are available. E-mail support@nexcelom.com or call 978-327-5340 for more information.
Software
Software upgrades available for the Cellometer Vision CBA Instrument
| Catalog # | Description | Size | Unit |
|---|---|---|---|
| VSL-01 | Cellometer Vision Software License for GMP/GLP Support | Single-user copy | 1 license |
| FCS-SW4RP-10 | Additional single-user copy of FCS Express 4 Flow, RUO Professional Software | Single-user copy | 1 license |
IQ / OQ Validation Package
Installation Qualification (IQ) and Operational Qualification (OQ) package for the Vision instrument.
| Service | Description | Size | Unit |
|---|---|---|---|
| Cellometer Vision-IQOQ | Counting chambers, reference bead solution, and IQ/OQ validation protocol for the Cellometer Vision | 100 counts | 1 Set |
On-Site Service, Maintenance, and Instrument Warranties
Trained Nexcelom Applications Specialists are available for on-site preventative maintenance, IQ validation, and OQ validation.
| Service | Description |
|---|---|
| Preventative Maintenance | Available for all Cellometer Systems
Please inquire for scheduling and pricing. |
| IQ Validation* | Available for Auto T4 and Vision Systems
Please inquire for scheduling and pricing. |
| OQ Validation* | Available for Auto T4 and Vision Systems
Please inquire for scheduling and pricing. |
| Extended Warranty | Available for all Cellometer Systems currently under a valid warranty.
Please inquire for pricing. |
*IQ/OQ Validation Package must be purchased separately
Models and Specifications for Cellometer Vision CBA Image Cytometer
| Cellometer Vision CBA | Cellometer Vision | |
|---|---|---|
| Includes |
|
|
| Magnification Selection |
|
|
Cell Size:
Conc. Range:
Bright field imaging, fluorescent imaging and pattern-recognition software to quickly and accurately decluster, identify and count individual cells. *Cellometer CHT4-PD300 Slides are required for cells > 80 microns in diameter |
Cell Size:
Conc. Range:
Bright field imaging, fluorescent imaging and pattern-recognition software to quickly and accurately decluster, identify and count individual cells. *Cellometer CHT4-PD300 Slides are required for cells > 80 microns in diameter |
|
| Instrument Specification |
|
|
PC/Laptop Requirements
(if purchasing Cellometer without PC laptop) |
Intel Mac with Parallels/Windows |
Intel Mac with Parallels/Windows |
| Available Fluorescent Optics Modules | VB-450-302
Excitation / Emission: 375nm/450nm Example Fluorophores:
VB-535-402 Excitation / Emission: 470nm/535nm Example Fluorophores:
VB-595-502 Excitation / Emission: 525nm/595nm Example Fluorophores:
VB-660-503 Excitation / Emission: 540nm/660nm Example Fluorophores:
VB-695-602 Excitation / Emission: 630nm/695nm Example Fluorophores:
|
VB-450-302
Excitation / Emission: 375nm/450nm Example Fluorophores:
VB-535-402 Excitation / Emission: 470nm/535nm Example Fluorophores:
VB-595-502 Excitation / Emission: 525nm/595nm Example Fluorophores:
VB-660-503 Excitation / Emission: 540nm/660nm Example Fluorophores:
VB-695-602 Excitation / Emission: 630nm/695nm Example Fluorophores:
|
For customized optical modules, email support@nexcelom.com or call: 978-327-5340.
Get Flow Results without Flow Cytometry
Incorporation of FCS Express Software into the Vision CBA Analysis System has enabled users to conduct image-based analysis of cell-based assays requiring enhanced gating for the most accurate, reliable, and reproducible results. Side-by-side comparison of results for apoptosis, cell cycle, mitochondrial potential, autophagy, ABC transporter assays, aggresome detection, CD4+ / CD8+ immunophenotyping, and other assays has shown Cellometer image-based analysis results to be comparable to flow cytometry.
Flow core labs can utilize the Vision CBA instrument to pre-screen samples prior to sorting and flow cytometry analysis and to run 1-color and 2-color assays for cell cycle, apoptosis, GFP transfection, mitochondrial potential, and more … freeing up their flow system for the more complex studies.
Individual researchers performing simple 1-color and 2-color analysis appreciate the simplicity and accessibility of the Vision CBA. The ability to analyze samples right away, using only 20µl of sample, enables researchers to accelerate and expand their experiments. Researchers can analyze a number of time-points, rather than one endpoint result. The FCS Express Software offers straightforward data analysis procedures and outputs familiar to many flow users.
FCS Express Software Features
- Colorized scatter plots and histograms
- More accurate gating for enhanced sensitivity
- Pre-set, optimized data layouts
- Simple import and creation of data layouts for new assays
- Flow-like data presentation
- Multi-sample data formatting
- Convenient Export to Excel
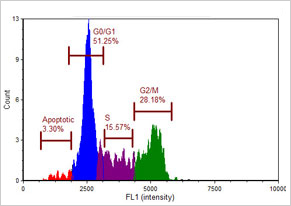
Customized Data Layouts
As shown in the Nexcelom data layout to the left, FCS Express Software plots data based on fluorescence intensity and default gating parameters. The data table displays the cell percentage and cell concentration for each phase of the cell cycle. Gating is manually optimized by dragging the gating bars in the histogram. Cell percentages and concentrations are instantly updated in the associated data table.
For analysis of Apoptosis with Annexin V-FITC / PI, FCS Express Software generates colorized scatter plots indicating live, apoptotic and dead cells with an associated data table indicating the % of cells and cell concentration in each category.
If you do not currently have FCS Express but would like to see data layout examples, you can download the following PDF samples:
The Cellometer Vision CBA has removed the variances regarding human error and subjectivity testing essentially overnight from our operations!
The Cellometer Vision CBA Image Cytometer is a great machine! It gives very precise results in a very short time, and only uses a small amount of sample, which makes it very efficient for research purposes.
Using the Cellometer Vision CBA has saved me so much time! I am able to get consistent viability data with much less time spent on sample preparation. It has also been great to complete cell cycle analysis without using FACS.
The Cellometer Vision CBA has removed the variances regarding human error and subjectivity testing essentially overnight from our operations! – Joseph Thomas, Mass Bay Brewing Company
I frequently use the Cellometer Vision CBA and I really like it!
The Cellometer Vision CBA makes my life so much easier! It makes cell counting a breeze! It is quick and very easy to use. You can count your cells with a turn of a knob and with a click of a button!
The Cellometer Vision CBA works great and is really efficient. Earlier, I used to work with the Cellometer Auto T4 but then switched to the Vision CBA. With the Cellometer, I consumed less time and it helps me get research work done effectively!
The Cellometer Vision CBA definitely saved me from spending hours on the microscope counting cells and it spared me the need to understand complicated FACS analysis.
The Cellometer Vision CBA is user-friendly, making it easy to understand the software and it delivers fast results! – Lyanne Suarez, University of Puerto Rico Aguadilla
The Cellometer Vision CBA Image Cytometer is a great machine! It gives very precise results in a very short time, and only uses a small amount of sample, which makes it very efficient for research purposes. – Nelson Franqui, Darlington Building
We have the Cellometer Auto T4, Cellometer Auto 2000 and Cellometer Vision CBA. Our Cellometers are reliable and every time I call for a product or technical service, I have spoken to a helpful and knowledgeable person.
We use the Cellometer Vision in our lab. We love this machine! It always gives us quick and clear cell counts!
The Cellometer Vision CBA instrument quickly counts cells and measures viability. The instrument is quick and easy to use. Counting cells using the Cellometer is much easier than using a hemacytometer!
The ease at which I can count bone marrow samples without Red Cell Lysis buffer to get total nucleated cell counts quickly and accurately with the Cellometer Vision CBA has allowed our research to expand drastically! – Daniel Kuebler, Franciscan University
The Cellometer Vision CBA is a perfect cross between the Bio-Rad cell counter and regular flow cytometer. We are just beginning to use this method of platelet counting and we are looking forward to continuing to use this instrument! – Shauna-Kay Spencer, University of Mississippi Medical Center
Our experience using the Cellometer Vision CBA has been great! It is so useful. We recommend the instrument due to convenience and speed of reading.
The Cellometer Vision CBA has helped me complete my experiments much faster! The instrument allows for rapid cell counts and even has a tool that can help calculate the cell concentration in no time. I love the counting chambers that are easy to load as well!
The Cellometer Vision CBA makes counting cells so much easier and less labor intensive!
The Cellometer Vision CBA has greatly streamlined our cell counting activities and its versatility has enabled us to customize many unique counting protocols for different cell lines. All in all, well worth the investment!
The Cellometer Vision CBA is very helpful with cell viability and plating. It really saves time!
The Cellometer Vision CBA has been so useful because now we do not waste a lot of time counting cells. Also, proliferation and viability experiments are too easy to analyze using this Cellometer! – Ana Milena Reyes Ramos, University of Puerto Rico – Mayaguez
The Cellometer Vision with your specialized chlorophyll fluorescein module will save us countless hours of microscope work by providing a reliable viability count of cells in a matter of minutes. We love it!
The Cellometer Vision CBA has helped us optimize a lot of our experiments. Not only is it fast and reliable, but it is easy to modify and create assays within the program. I would recommend it to others!
We were originally using the Cellometer Auto T4 system for cell count and viability and it made our cell counts quicker than when using a hemacytometer! But now we have upgraded to the Cellometer Vision CBA, and the focusing time is almost on par with a conventional microscope and with the extremely useful fluorescent cell counting. This system will probably outlast the computer we use to operate it! -Reinaldo Agostini, University of Puerto Rico
Before our lab moved, we were utilizing the Cellometer Vision CBA from Nexcelom. The capabilities of this machine are amazing. The Propidium Iodide (PI) staining for cell cycle analysis was the function we used most frequently. This helps remove the need for a large volume of cells like flow would require. Since our cell lines were going into arrest after our manipulations, we were unable to generate large quantities of cells for traditional flow. The Vision CBA fit perfectly for our needs. Now, we use the Cellometer Mini due to financial constraints when our lab moved. It is still a great instrument, but if given the chance, I’d 100% without a doubt go back to the Cellometer Vision CBA. There are too many things it can do to pass it up! -Amy Rosado, Nemours Children’s Hospital
The Cellometer Vision CBA has provided highly trustworthy and fast results using the powerful algorithms for automated image-based cell counts and flow-like analysis. Plus, there is no need to clean up the instrument and it is a very user-friendly interface. I highly recommend it!
Our Cellometer Vision CBA allows us to easily and accurately perform cell-based assays for our drug resistance experiments!
The Cellometer Vision CBA is by far the best product we have used in our lab. In such little time, this small machine can capture images, analyze data and upload your data into a neat powerpoint that can be used immediately. We have used this machine for apoptosis assays and cell cycle assays and it has not disappointed!
The Cellometer Vision is a great product! The instrument is quick and easy to learn to use, and the software is very user-friendly. We have used our Cellometer to obtain data that we would normally have to use the flow cytometry facilities to get. The machine has made a number of data types both inexpensive and quick to obtain. In addition to the product itself, the customer service we have received is excellent – only adding to the quality of the product!
Using the Cellometer Vision CBA has saved me so much time! I am able to get consistent viability data with much less time spent on sample preparation. It has also been great to complete cell cycle analysis without using FACS. – Sarah Burkhart, Florida State University College of Medicine- Biomedical Sciences