Plaques and Foci Counting
High-throughput Plaque and Foci Counting in Bright Field and Fluorescence Imaging
- High-throughput automated imaging and analysis directly in plates
- Directly count infected cells in plates without trypsinization
- Image and analyze a 96-well plate in 8 min
Introduction to Plaque and Foci Counting
The ability to quantify viral infectivity by automated counting of plaques and foci is highly important. In order to rapidly and efficiently determine viral infectivity, multiple conditions or titrations need to be tested with the virus and host cells. There are various types of plaques and foci using horse radish peroxidase or fluorescent labeling with markers or proteins. These allow the development of high-throughput counting of foci and plaques.
Protocol
- The host cells are seeded and allowed to adhere to the surface of the 96-well micro plates for 24 hours
- Different concentrations or amount of virus particles are added to the plate for measuring the infectivity of the virus
- Example 1: The infection zone allows clearing of host cells where the host cells are then stained with crystal violet to create contrast between the cells and the opening
- Example 2: infected foci or plaques can be labeled with horse radish peroxidase or fluorescence-conjugated antibodies, or fluorescent viral proteins
- The host cell samples are then imaged and analyzed using Celigo image cytometer to count the number of plaques and foci
Directly Counting Viral Plaques in 6-well Microplates
- Vero host cells are seeded in a 96-well microplate and allowed to adhere overnight
- Three different concentrations of viral particles are prepared and added to the host cells
- The samples are allowed to incubate for 48 hours
- After incubation, the host cells are stained with crystal violet, revealing viral plaques (zones of clearing)
- Finally, the plate is imaged and analyzed with Celigo image cytometer to count the number of plaques
Whole well bright field and counted images
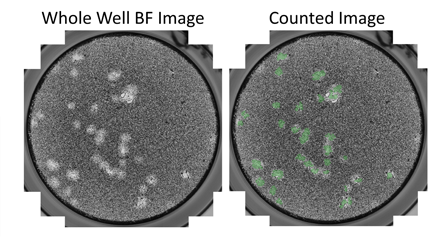
Example bright field images show the counting of viral plaques in 6-well plates
Zoom in bright field and counted images
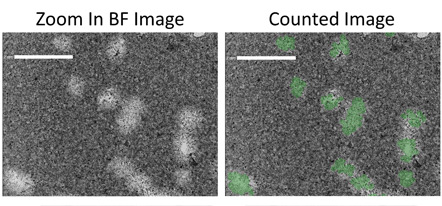
Zoomed in example bright field images show the counting of plaques in 6-well plates
High-throughput Quantification of Virally Induced Plaques, Counter Stained with Horse Radish Peroxidase in 96-well Plates
- Host cells are seeded in a 96-well micro plate and allowed to adhere overnight
- Different viral particles are prepared and added to the host cells
- The samples are allowed to incubate for 24 hours
- After incubation, the infected foci are labeled with primary anti-viral protein antibody and a horse radish peroxidase (HRP) conjugated secondary
- Finally, the plate is imaged and analyzed with Celigo image cytometer to count the number of infected plaques
Bright field and counted images of plaques formed from different viruses

Example bright field images show the counting of HRP positive infected plaques
High-throughput Quantification of Fluorescent Foci of Influenza Infected Vero Cells in 96-well Plates
- Vero host cells are seeded in a 96-well micro plate and allowed to adhere overnight
- A 5-fold titration of influenza viral particles are prepared and added to the host cells
- The samples are allowed to incubate for 24 hours
- After incubation, the infected foci are labeled with primary viral protein antibodies conjugated with Dylight 488
- Finally, the plate is imaged and analyzed with Celigo image cytometer to count the number of infected cells
Example fluorescent images show the counting of Dylight 488 positive infected cells
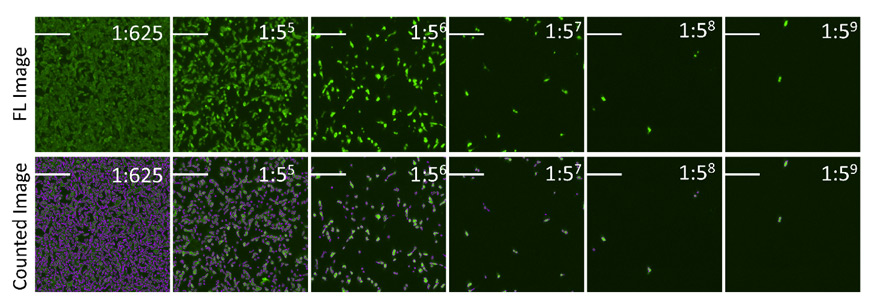
The percent Dylight 488 positive cells are counted to generate an infectivity curve shown below, and the results are compared directly to manual counting, which only covered 10% of the well
Influenza Infected Foci
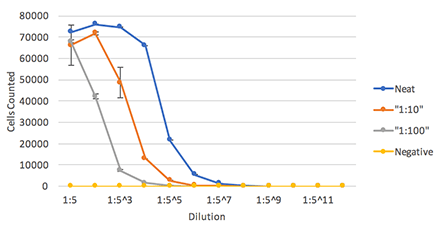
| Log10 (FFU/mL) | Celigo | Manual |
|---|---|---|
| Neat | 8.97 | 9.03 |
| 1:10 | 8.05 | 8.03 |
| 1:10 | 7.99 | 7.90 |
| 1:100 | 6.97 | 6.99 |
| 1:100 | 6.99 | 7.04 |
Celigo showed highly comparable plaque counting results to manual counting method.
High-throughput Quantification of Fluorescent Plaques of Influenza Infected Vero Cells in 96-well Plates
- Vero host cells are seeded in 96-well micro plates and allowed to adhere overnight
- A 2-fold titration of GFP-influenza virus particles are prepared and added to the host cells
- The samples are allowed to incubate for 24 hours and then imaged and analyzed with Celigo image cytometer to count the number of infected cells
Whole well fluorescent image of infected fluorescent plaques for each dilution
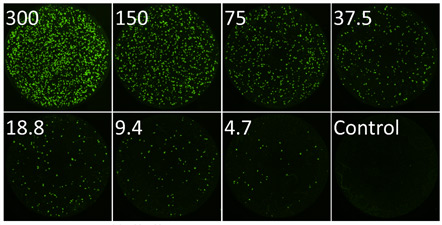
The top set of images show the whole well imaging of fluorescent viral plaques captured on the Celigo image cytometer. A whole well image was captured for each viral dilution providing a whole well view of the viral infection.
Infected fluorescent plaques directly counted in green fluorescence channel using the Colony Application
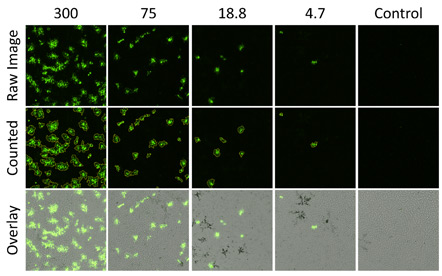
The top row shows zoomed in images of viral fluorescent plaques captured of the Celigo. The middle row is the viral plaques that have been analyzed by the Celigo software. The identified plaques are automatically circled by the software. The bottom row is showing an overlay of the bright field and the fluorescent images. The Celigo software allows for the overlay of multiple images from multiple channels to be overlayed with a click of a button.
Fluorescent plaque counting results
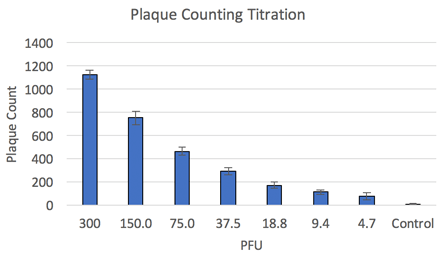
Once the viral plaques are imaged and counted by the Celigo all of the data is exported to excel for further analysis. The number of viral plaques is graphed over the performed dilution series of the virus. This data shows that the number of viral plaques is directly related to the amount of virus added to each well.
