Insect Cells
Introduction to Insect Cell Analysis
Although there are many insect cells that are routinely studied and used in research, the most common is the Sf9 cell line. Originally derived from the Spodoptera frugiperda (fall armyworm) moth and adapted for cell culture. The Sf9 cells are highly susceptible to baculovirus, which is widely used for expression of particular genes in the cultured insect cells. The expression of such genes lead to a robust production of proteins by Sf9 cells. In this protein expression process it is vital to know the concentration and viability of the Sf9 cells both for a healthy transfection as well as a robust protein production. The Cellometer line of instruments measures the cell concentration and viability as well as the cell size. Because cell size has been linked with a healthy viral infection and protein expression measuring and monitoring cell size is an effective tool for monitoring cell culture health.
Measuring cell size and viability of insect cell lines Sf9, Sf21 and High 5
Cellometer Auto T4 is used to count cell concentration, viability and also analyze size distribution of insect cells, such as SF9, SF21, and High 5. Cell size analysis is used to monitor SF9 cultures before and after infection. Multiple cell size data can be displayed on the same histogram.
Reference: “A rapid method for estimation of baculovirus titer based on viable cell size”, V. Janakiraman, W. F. Forrest, B. Chow, S. Seshagiri, Department of Moledular Biology, Genentech Inc, Department of iostatistics, Genentech Inc. Journal of Virological Methods, 132, (2006), 48-58
Procedure for Counting Insect Cells
- Mix insect cell culture with trypan blue.
- Pipette 20 µl of the mixture solution into sample introduction port of a disposable counting chamber (CHT4).
- Insert chamber slide into Auto T4 instrument.
- Obtain cell concentration, viability and cell size diameters.
Automatic Imaging and Cell Identification by the Cellometer Software
SF9 Cell Images
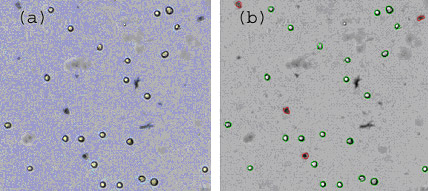
Mean cell size equals 18.3 micron. (a) Raw data image and (b) counted cells are circled in green for live cells and red for dead cells.
Viability of SF9 Cells
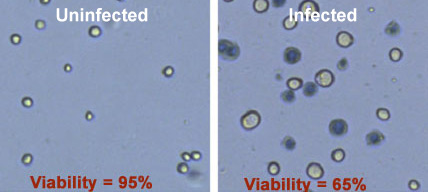
Cellometer Auto T4 images and viability analysis of uninfected and infected Sf9 cells. The uninfected sample has very few trypan blue positive cells and as a result is 95% viable. The infected sample has many more trypan blue positive cells and has a reported viability of 65%.
Cellometer Auto T4 generated cell size histogram of uninfected Sf9 cells
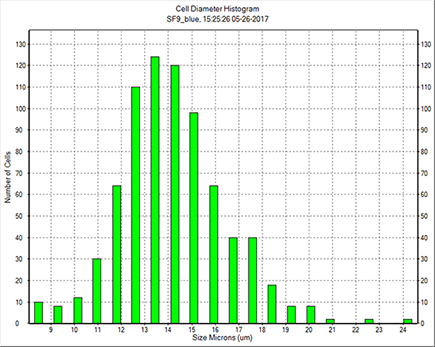
Cell size distribution of imaged cells is automatically generated as a histogram. The histogram above displays the number and size of uninfected Sf9 cells. Most of the uninfected cells are in the range of 11 to 18 microns in diameter. This data can also be exported into excel for further data analysis.
Cellometer Auto T4 generated cell size histogram of baculovirus infected Sf9 cells
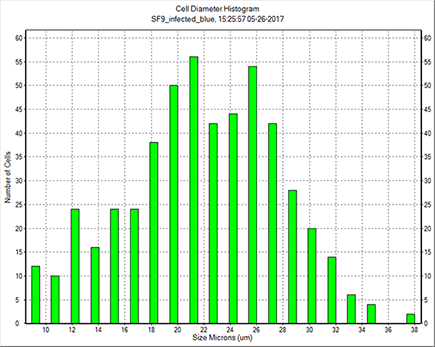
Cell size distribution of imaged cells is automatically generated as a histogram. The histogram above displays the number and size of Sf9 cells infected with baculovirus. Most of the infected Sf9 cells are in the range of 17 to 30 microns in diameter. This data can also be exported into excel for further data analysis.
Overlay of infected and uninfected Sf9 cell counts on Cellometer Auto T4
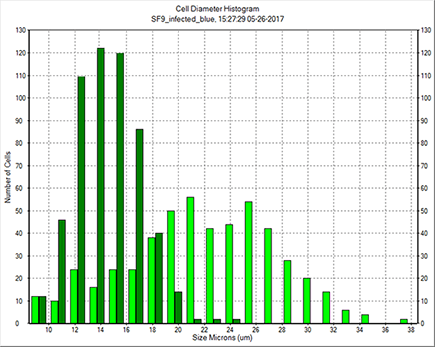
The Cellometer T4 software allows for the plotting of multiple populations simultaneously. In the histogram above the infected cell population was overlayed with the uninfected cell population to show the shift in cell size after infection with baculovirus. Predominantly the cells increased in size from an average of 15 microns to an average of 25 microns.
Imaging and Counting of High Five (High 5) Cells
Similarly to Sf9 and Sf21 cells, the High Five cells are also used in the expression of various proteins. These loosely adherent to suspension cell lines can be easily imaged on any Cellometer to determine cell concentration, viability and size.
High 5 Cells
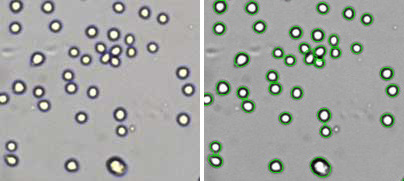
A bright field High 5 cell image is shown on the left, with the counted cell image on the right showing counted cell outlined in green.
References
Janakiraman V, et al (2006). A rapid method for estimation of baculovirus titer based on viable cell size. Journal of Virological Methods, 132(1-2):48-58
