Quantify Viral Antibody Neutralization
Measure Antibody Neutralization using Direct Cell Counting in 96-well Microplates using the Celigo Image Cytometer
- High-throughput automated imaging and analysis directly in plates
- Directly count infected cells in plates without trypsinization
- Measure antibody neutralization effect in 8 min
Introduction to Measuring Antibody Neutralization
Antibody neutralization assays utilize antibodies or directly with serum to prevent infectivity of viruses. In general, the host cells are treated with different titrations of the neutralizing antibodies or sera. Next, the viruses are allowed to infect the host cells at different infectivity. Finally, each titration is analyzed to determine the infectivity and quantify the neutralization capabilities of the antibodies or sera.
Protocol
- First the virus particles (RVPs) are incubated with different titrations of human sera for 1 hour at 37 °C
- Raji cells are then infected with the antibody-RVP complexes and seeded in a 96-well microplate
- The plate is then incubated at 37 °C for 48 hours
- After incubation, the plate is imaged and analyzed (8 min/96-well plate) using the Celigo image cytometer to count the number of GFP positive infected cells
- The results are plotted as a dose response of sera titration and the IC50 values are calculated using Graphpad prism
Measure Antibody Neutralization of Different Antibodies on Zika Virus using Direct Cell Counting in 96-well Plates
- Raji cells and 6 different antibody-RVP complexes (Zika virus) are infected and seeded in 96-well microplates following the protocol described above
- After 48 hours, the Celigo image cytometer was used to count the number of GFP positive infected cells in each well to generate a dose response curve for all tested antibody-RVP complexes
- Two sets of example images of antibody-RVP complexes treatment are shown below, where GFP positive infected cells can be observed at different antibody concentrations
Bright field and fluorescent overlay images of Zika virus-infected cells
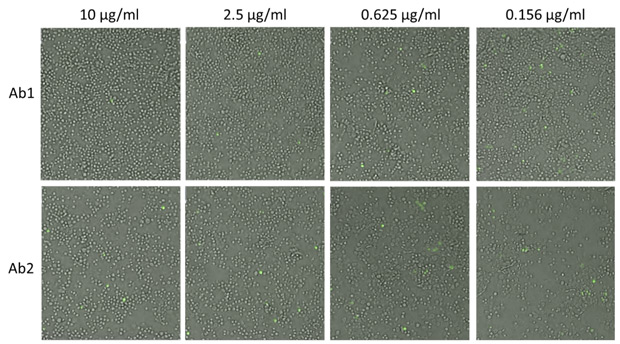
Example images of antibody-RVP complexes treatment showing an increase in the number of infected (GFP positive) cells as antibody concentrations decreased.
Directly count cells in images
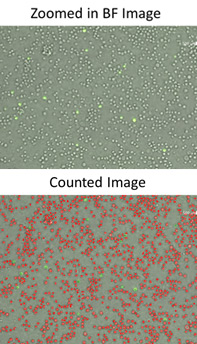
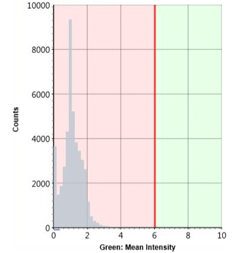
Celigo was used to count the total number of cells in bright field and identify the GFP positive cells in histogram gating.
- After counting the number of infected cells and total cell count for each antibody-RVP complex and concentrations using the gating function in Celigo, a dose-response plot of percent infection is generated and IC50 values are calculated.
Green: Mean Intensity Histogram
- The dose-dependent antibody neutralization IC50 results are directly compared to FACS and are highly comparable.
Celigo
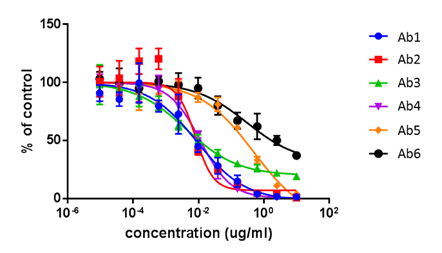
Antibody neutralization dose-response curves for 6 antibodies using Celigo.
FACS
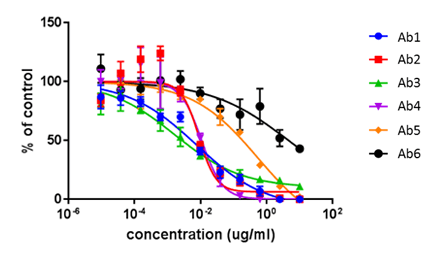
Antibody neutralization dose-response curves for 6 antibodies using FACS.
| IC50 (µg/ml) | Ab1 | Ab2 | Ab3 | Ab4 | Ab5 | Ab5 |
|---|---|---|---|---|---|---|
| FACS | 0.0077 | 0.0089 | 0.0017 | 0.011 | 0.547 | 4.683 |
| Celigo | 0.0090 | 0.0081 | 0.0042 | 0.011 | 0.489 | 0.307 |
Measure Antibody Neutralization of Different Sera on Cytomegalovirus using Direct Cell Counting in 96-well Plates
- The ARPE epithelial host cells are seeded in 96-well microplate and incubated for 24 hours to allow the cells to adhere
- The cells are then infected by cytomegalovirus and incubated with titrations of different sera for another 24 hours
- Finally, the cells are stained with primary antibodies conjugated with Alexa Fluor 647 (AF647) or Horse Radish Peroxidase (HRP)
- After staining, the cells are imaged and analyzed using the Celigo image cytometer to count the number of infected cells
Bright Field-based Antibody Neutralization Assay using Horse Radish Peroxidase (HRP)
Bright field images of HRP-stained infected cells at high serum
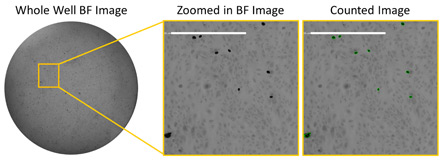
The example image shows the low number of infected cells with high serum concentration in bright field using HRP
Bright field images of HRP-stained infected cells at low serum
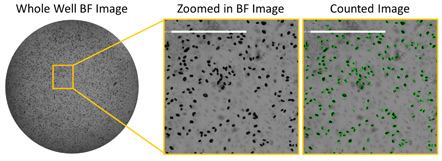
The example image shows the high number of infected cells with low serum concentration in bright field using HRP
Whole plate image and antibody neutralization dose-response curves of 4 sera
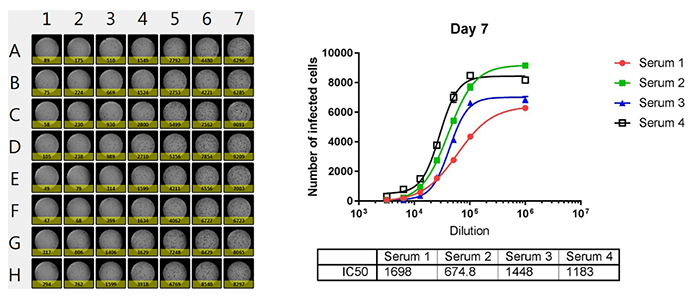
The number of infected cells is counted and dose response curves are generated for 4 different sera, where the IC50 values are calculated. The Celigo is able to output the counted results directly to Excel for analysis.
Fluorescence-based Antibody Neutralization Assay using AF647
Fluorescent images of AF647-stained infected cells at high serum

The image shows the low number of infected cells with high serum concentration in fluorescence using AF647
Fluorescent images of AF647-stained infected cells at low serum

The image shows the high number of infected cells with low serum concentration in fluorescence using AF647
Whole plate image and antibody neutralization dose-response curves of 4 sera
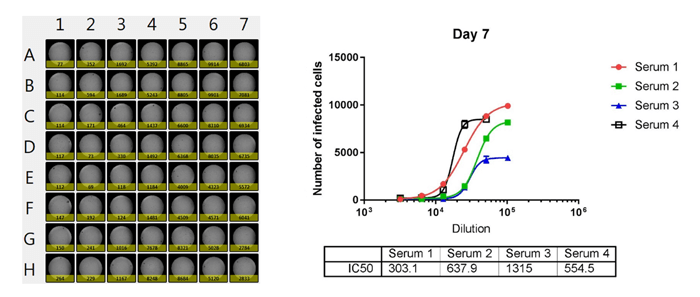
The number of infected cells is counted and dose response curves are generated for 4 different sera, where the IC50 values are calculated. The Celigo is able to output the counted results directly to Excel for analysis.
