Monitor Viral Infections
Monitoring Spread of Viral Infection Directly in Multi-well Microplates
- Whole well imaging allows for tracking of viral infections in large cell populations
- Perform in-plate infections, staining and imaging with no need for trypsinization
- Calculate percent of virally infected cells by preforming a direct cell count
- Improve throughput, scan and analyze a 96-well plate in <15 minutes
Introduction to Viral Infection
Typically, viral infections are visualized and imaged using a conventional or semi-automated fluorescent microscope platform. Because data quantification (counting the number of virally infected cells) is often performed manually the number of fields showing infected cells is often low and takes a considerable amount of time to analyze. Celigo image cytometer provides a fast imaging and quantification solution for live cell analysis of viral infection. The entire 96 well plate is scanned, individual virally infected cells are detected and the total number of infected cells is automatically quantified in a total of 15 minutes or less.
Protocol
- Grow cell of interest in a plate
- Infect cells with virus
- Incubate for a predetermined period of time
- Prepare for imaging by fixing the cells and staining with anti-virus primary and secondary antibodies. If the viral particles have an incorporated fluorescent protein reporter like GFP proceed directly to imaging
- Scan and analyze an entire 96-well plate using whole well imaging in under 15 minutes
- Export data to excel
- Export high definition images into JPEGs, TIFF or Bitmap
Perform In-plate Live Cell Tracking, Imaging and Data Analysis for Viral Infections
Live Cell Tracking of A549 Cells Infected with RSV (Respiratory syncytial virus) in 24-well Plates
Captured images show an increase in the number and intensity of GFP positive cells from 24 to 48 hours post infection. Uninfected control cells do not contain any fluorescent staining.
Live cell tracking of B2B cells infected with RSV (Respiratory syncytial virus) in 24-well plates
Captured images do not show an increase in the number and intensity of GFP positive cells from 24 to 48 hours post infection. Uninfected control cells do not contain any fluorescent staining.
Percent of GFP Positive Cells
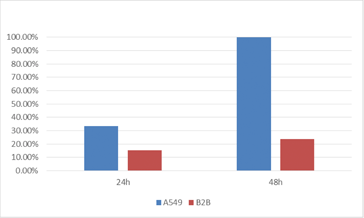
The percent of cells that are virally infected and therefore GFP positive was directly measured for A549 and B2B cell lines. The results showed a dramatic increase in the number of infected A549 cells compared to the number of B2B cells for the same time points.
GFP Mean Intensity
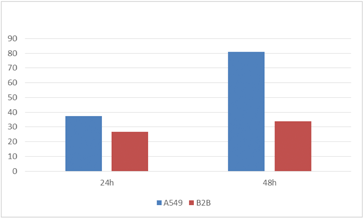
The mean GFP intensity per infected cell line was also measured and compared to each other. The GFP intensity for A549 cells at 48 hours post-infection was shown to be significantly higher compared to the B2B cells line.
Perform Whole Well Imaging and Analysis to Quickly Acquire Viral Infection Data for the Whole Plate
Fluorescent whole well images of time-dependent viral infection spread
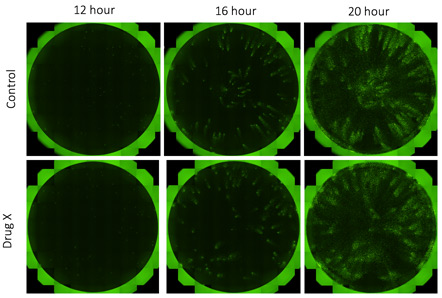
A 24-well plate was seeded with H4 control or H4 knock-out (KO) cells and infected with vesicular stomatitis virus (VSV). Whole-well imaging was performed for a virally infected 24-well plate in 10 minutes. The same plate was scanned over multiple time points to track the viral infection.
Fluorescent zoom in images of time-dependent viral infection spread

Zoomed in images of KO H4 cells treated with drug X at 12, 16 and 20 hours post infection with VSV. The number of GFP positive cells increased over time, indicating an increase in the viral infection.
Live-cell Tracking of GFP Viral Infection
The Celigo generated data showed that the knock-out version of the H4 cells was more susceptible to vesicular stomatitis virus infection compared to the control cell line. Additionally, the drug treatment did not have an effect in reducing the viral infection in either the control cell line nor the knock-out cell line.
Monitor Viral Infection after Fixation and Immunostaining Against Viral Proteins – Image and Collect Whole Well Data in Minutes
Whole-well images of influenza-infected epithelial cells
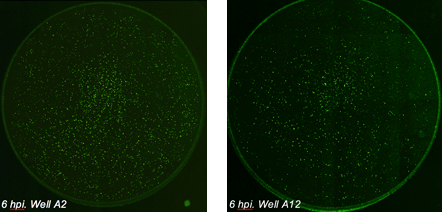
Epithelial cells were seeded in a 96-well plate and infected with influenza virus at different virus concentrations. After 6 hours post infection (hpi) the cells were fixed and stained with a primary antibody against influenza-specific protein and a secondary Alexa Fluor 488 conjugated antibody. Whole-well imaging for the entire plate (bright field, AF488 and Hoechst) took 13 minutes.
Bright field and fluorescent images of infected cells
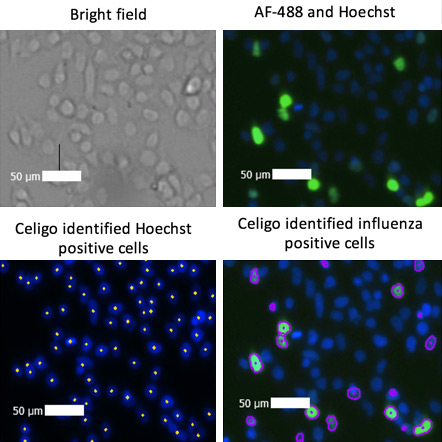
Celigo captured images in the bright field, green, and blue (Hoechst) channels. The built-in analysis software identified each Hoechst stained cell as well as each AF-488 virally infected cell.
Percentage of Cells Stained with AF488
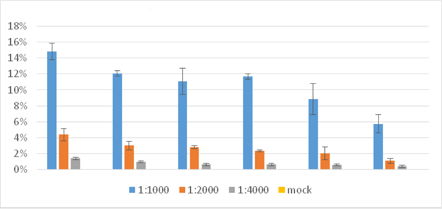
The percent of influenza-infected cells was shown to be directly proportional to the dilution of the virus. The highest percentage of infected cells was seen at 1:1000 dilution.
