Cell Counting Method
Many researchers may assume cell counting method represents the instrument used to perform the assay. The quality of the cell counting results is actually dependent on the cell counting assay and system, which includes not only the instrument, but also the assay, reagents, consumables, and the software analysis algorithms. The entire cell counting method should be treated as a process, where each component can significantly affect the quality of the results.
Cell Counting Method
Choosing a Cell Counting Assay
Once the knowledge collection phase is complete, researchers can consider the intended use and sample composition to determine which cell counting assay is appropriate. There are four categories of cell counting assays relating to how the cells or measurands are assessed: direct total, indirect total, direct differential, and indirect differential (Table 1).
Below are the definition for each category and a table correlating to cell counting assay example.
- Direct cell counting is the detection of independent signal(s) for each cell.
- Indirect cell counting is the measurement of a signal from a population of cells, which is relayed back to the cell number through a mathematical model.
- Total cell count includes the count of all cells, regardless of attributes.
- Differential cell count refers to a distinguished subset of cells that is identifiable from other cell subpopulations by some measurable attribute.
| Cell counting categories | Cell counting assay example |
|---|---|
| Direct Total | Bright field counting all cells in hemacytometer |
| Indirect Total | MTT or MTS assays to measure viable cells |
| Direct Differential | Fluorescent cell counting with live cells stained with acridine orange, dead cells stained with propidium iodide |
| Indirect Differential | Luciferase assay to measure cytotoxicity of T cells killing tumor cells |
Table 1. Different counting categories for cell counting measurands
A cell counting assay should be selected to best measure the intended measurands in the target cell sample, and probes should be selected based on the cell sample, application, and biological phenomenon. Researchers have been increasingly moving towards direct cell counting methods for assessing cell concentrations. A recent publication in PLOS ONE demonstrated that utilizing an indirect counting method such as MTS or MTT assays can yield misleading results because the ATP content can be affected by various drug treatments induced on the target cells1.
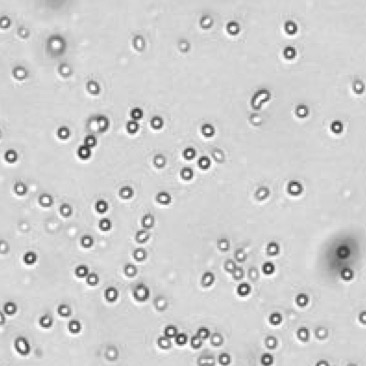
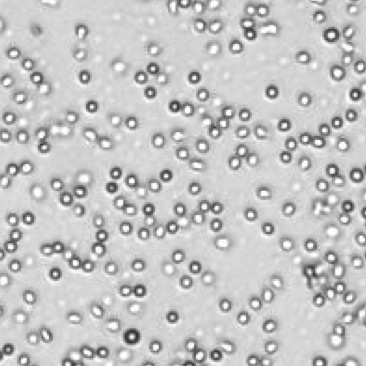
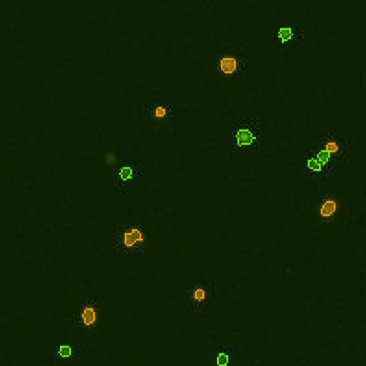
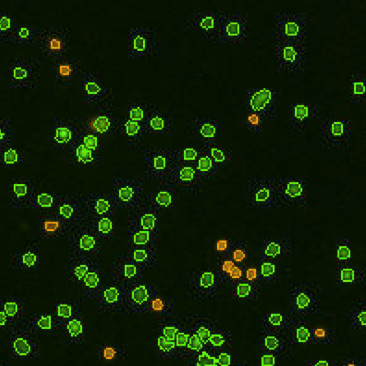
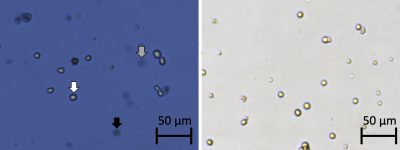
The consideration of both measurands and biological phenomenon will then be used to determine the probe of choice for cell counting. The choice of probe, and the resulting signal, should be carefully considered, not just in terms of the sample biology, but also with regard to other potential sample traits such as presence of debris or nonspecific cell types, and sample media. A simple example is shown in Figure 1, the measurands are both live and dead cells, and the biological phenomenon is cell membrane permeability, where the selected probe is trypan blue for detecting colorimetric visual signals from dead cells. Another example, in Figure 2, the measurands are both live and dead cells, and the biological phenomenon is cell membrane permeability. However, fluorescent probes were selected, both to specifically identify PBMCs from the contaminating cell types and cellular debris, and to easily differentiate the live and dead cells within the sample (Figure 2).

| What is the measurand (objects intended to measure)? | Live and dead cells |
| What is the bioological phenomenon you are measuring? | Cell membrane permeable |
| What is the probe of choice? | Trypan blue |
| What are the signals detected? | Live (refractive light), dead (blue color) |
Figure 1. Example assay principle for trypan blue stained CHO cells
There are a number of important factors to consider when choosing a counting assay. Researchers should consider not only the counting method category, but also the biological phenomenon, ideal probe, and signal to optimally count the cells of interest. Measurands can include live cells, dead cells, and combinations of both, total cells. While biological phenomenon might be cell membrane permeability, metabolic activity, presence/absence of biomarkers, and others.
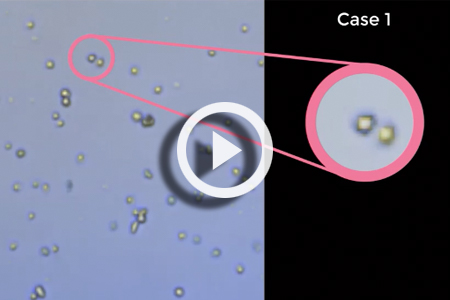
Video: Trypan blue interaction with dead/dying Jurkat cells
It is worth noting that there are slight behavioral differences with each nuclear fluorescent probe, and many require long incubation times in order to properly stain dead cells. Additionally, an incorrect probe choice can have a negative effect on cell counting accuracy, such as in the case of trypan blue. While this is one of the most commonly used probes to measure live/dead cells and cell viability, it can have adverse morphological effects on dead primary immune cells such as PBMCs or mouse splenocytes2, which can cause cells to rupture, thus decreasing dead cell count and increasing cell viability artificially3. Ultimately, probe choice is extremely context-specific, and must be made with respect to all previous considerations of the cell counting method.


| What is the measurand (objects intended to measure)? | Live and dead cells |
| What is the bioological phenomenon you are measuring? | Cell membrane permeable |
| What is the probe of choice? | Acridine orange and propidium iodide |
| What are the signals detected? | Live (green fluorescence), dead (red fluorescence) |
Figure 2. Example assay principle for isolated human PBMCs
Accurately Count PBMC and Measure Viability in the Presence of Residual RBC
Important key points for probe selection
- Trypan blue is the most common dye to measure cell viability, but make sure the viability is high, otherwise trypan blue can affect the morphology of the dead cells, over-estimating viability4
- If your cell sample contains other nonspecific particles such as RBCs, platelets, and debris, use fluorescent probes to ensure accurate counts5
- All nuclear fluorescent probes behave slightly differently. With the exception of PI, most of the dyes requires longer staining time in order to properly stain the dead cells, specifically with DAPI and 7-AAD6
- For dyes requiring longer staining time, make sure keep the cells in the dark to avoid photobleaching
Choosing an Automated Cell Counting System
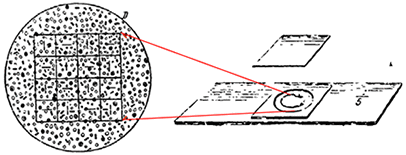
The simplest device for cell counting has been the hemacytometer or hemocytometer used with a standard light microscope. The hemocytometer has been the main instrument for counting cells since the 1800’s, and have evolved several times for two centuries. However, various issues are commonly known such as the operation is time-consuming and tedious, as well as variability that can result from operator errors. An automated cell counting system can be used to detect the biological phenomenon and signals from your measurands (cells) and probes. The cell counting system consists of not only the instrument, but also the reagents, consumables, and software algorithms for cell identification. By considering the different components of the cell counting system, an optimal selection can be made for the selected cell counting assay. The table below demonstrates examples of specific cell counting systems comprising instrument, reagents, consumable and software algorithm from Nexcelom Bioscience.
| Instrument | Reagent(s) | Consumable | Cell ID Algorithm |
|---|---|---|---|
| Impedance | |||
| Coulter Counter | Buffer | Buffer container | Total Count |
| Bright Field Only | |||
| Cellometer Auto T4 (advanced cell counter) | Trypan Blue | Slides | BF, TB, chamber height |
| Cellometer Auto 1000 (all-in-one counter) | Trypan Blue | Slides | BF, TB, chamber height |
| Bright Field + Fluorescence | |||
| Cellometer K2 (advanced cell counter) | Trypan Blue, AO/PI | Slides | 13 Total: FL only, FL1 + FL2, dual FL, etc. |
| Cellometer X2 (yeast cell counter) | Trypan Blue, AO/PI | Slides | 13 Total: FL only, FL1 + FL2, dual FL, etc. |
| Cellometer Auto 2000 (all-in-one counter) | Trypan Blue, AO/PI | Slides | 13 Total: FL only, FL1 + FL2, dual FL, etc. |
| Cellometer Spectrum (advanced counter with 2 color cell-based assays) | Trypan Blue, AO/PI, Hoechst/PI, etc. | Slides | 13 Total: FL only, FL1 + FL2, dual FL, etc. |
| Cellaca MX High-throughput Cell Counter | AO/PI, Hoechst/PI, PI only, etc. | Chamber plate | 13 Total: FL only, FL1 + FL2, dual FL, etc. |
Table 2. Examples of cell counting systems for selection
| Sample #7 | Sample #6 | Sample #2 | Sample #5 | |
|---|---|---|---|---|
| Total cell count | 49 | 1419 | 10635 | 24245 |
| Live cell concentration | 1.07E+05 | 2.84E+06 | 3.11E+07 | 6.75E+07 |
| Viability | 63.20% | 58.00% | 84.40% | 80.30% |
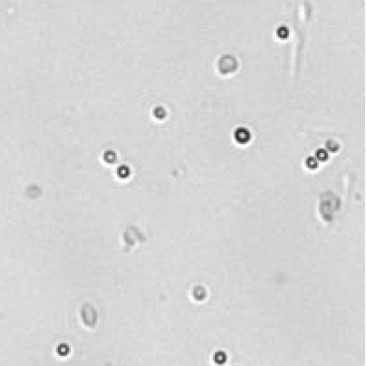
| Bright field cell image | 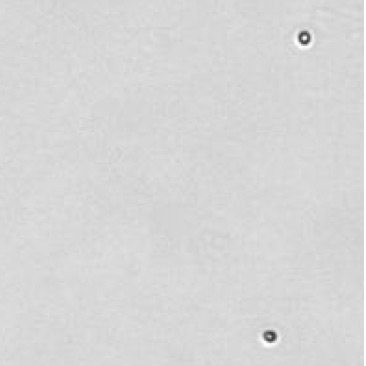 |
 |
 |
 |
| Counted live & dead cell image |  |
 |
 |
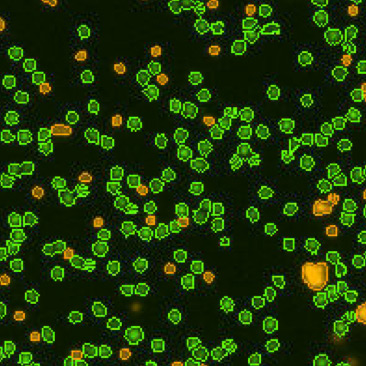 |
Table 3. Eliminating dilution steps with the Cellometer Auto 2000
A critical consideration for any cell counting instrument is the range without dilution. Some instruments may indicate a large cell concentration range, but may require multiple dilutions, which can increase the Coefficient of Variation (CV) of the cell counting results. Therefore, it is important to know the actual cell counting range in the absence of any dilution steps (Figure 8). Demonstration of this concept is observed in an experiment performed by measuring cell count and viability of lymphocytes from 30 different mice using the acridine orange/propidium iodide. The Cellometer Auto 2000 showed that mouse lymphocytes can be properly measured within a range from 1 x 10⁵ to 6 x 10⁷ cells/mL without additional dilution steps (Table 3). Therefore, researchers can reliably use automated cell counting instrumentation to measure within this range, thus avoiding dilution as a confounding factor.
Beyond dilution range, there are multiple additional factors when choosing a cell counting system, including what reagents and consumables are required. While reagents can affect cell counting itself through the type, fluorescence color, or strength of signal, they also can affect general experimental flow through cost, availability, and ease of access. Additional consumable considerations include sterility and reusability, as well as shelf-life. Finally, researchers must carefully consider the software used to count cells, as algorithms between systems can vary drastically. The system software should be able to accurately assess the desired measurand, which may include many considerations for the usability of the software. Ultimately, the cell counting system chosen will be specific to the sample and desired result and should be made with consideration to long-term consistency, especially when considering manufacturing applications.
Identifying and Resolving the Sources of Hemocytometer Counting Error through Automation
References:
- Chan GK, Kleinheinz TL, Peterson D, Moffat JG. A simple high-content cell cycle assay reveals frequent discrepancies between cell number and ATP and MTS proliferation assays. PLoS One. 2013;8(5):e63583
- Chan LL, Kuksin D, Laverty DJ, Saldi S, Qiu J. Morphological observation and analysis using automated image cytometry for the comparison of trypan blue and fluorescence-based viability detection method. Cytotechnology. 2015;67(3):461-473.
- Chan LL, Rice WL, Qiu J. Observation and quantification of the morphological effect of trypan blue rupturing dead or dying cells. PLoS One. 2020;15(1):e0227950. Published 2020 Jan 24. doi:10.1371/journal.pone.0227950
- Chan LL, Laverty DJ, Smith T, et al. Accurate measurement of peripheral blood mononuclear cell concentration using image cytometry to eliminate RBC-induced counting error. J Immunol Methods. 2013;388(1-2):25-32.
- Chan LL, Wilkinson AR, Paradis BD, Lai N. Rapid image-based cytometry for comparison of fluorescent viability staining methods. J Fluoresc. 2012;22(5):1301-1311
- Chan LL, McCulley KJ, Kessel SL. Assessment of Cell Viability with Single-, Dual-, and Multi-Staining Methods Using Image Cytometry. Methods Mol Biol. 2017;1601:27-41.
Additional Resources
Comparing Trypan Blue and AO/PI Staining Methods
A time-course study to compare cellular viability measured with TB and AO/PI using an automated image-based cytometry method. Read More about “Comparing Trypan Blue & AO/PI Staining Methods”…
Is Trypan Blue Leading to an Over-Estimation of Viability?
It is important to select the most accurate cell counting method that is fit-for-purpose where cell number and viability significantly affect treatment efficacy. Read More about “Is your trypan blue rupturing dead or dying immune cells leading to an over-estimation of cell viability?”…
Historical Development of the Hemocytometer
A history from the beginning of hematology to the instrument modifications that led to the device that is currently used today. Read More about “History of the Hemacytometer”…
Sources of Hemacytometer Counting Errors
The hemacytometer remains an integral part of all cell-based research, and yet sources of error inherent in its design and utilization persist. Read More about “Sources of Hemacytometer Counting Errors”…