Accurate Cell Count & Viability Measurement for Clinical Primary Samples in Immunology
Introduction to Immunology
The field of immunology encompasses many different areas of study and therefore has a very broad range of primary samples. Here we outline some significant samples that researchers are examining on a daily basis. They range from human primary and clinical samples to immobilized cell lines to cell samples from murine models.
Although there is a great variety of clinical and primary samples, most often the concentration and viability is determined by a single method: hemocytometer counting using trypan blue. This counting method may not be optimal for all samples. Samples such as bone marrow, cord blood, tissue digests, bronchoalveolar lavage, and other primary and clinical samples may be contaminated with residual red blood cells, tissue and cellular debris. These contaminants can lead to inaccurate enumeration of immune cells.
Nexcelom’s solution is to perform fluorescent based cell analysis using acridine orange (AO) and propidium iodide. Since AO and PI are nucleic acid dyes, they will bind to and label only the DNA of live and dead nucleated cells. This method allows for the identification, enumeration, as well as provides cell viability of nucleated cells in any sample.
Strategy for the detection of nucleated cells in complex primary samples
Directly measure total nucleated cells using acridine orange (AO) and propidium iodide (PI) staining and Cellometer automatic cell counter
- Stain sample with AO/PI at 1:1 ratio
- Load 20 µl stained cell sample into counting chamber
- Count and analyze sample using a Cellometer automated fluorescent viability counter (Auto 2000, K2, Vision)
Measuring Cell Concentration and Viability of Primary Cell Samples
Quantifying Cell Samples in 4 Easy Steps Using Fluorescent Viability Counter
Using a Cellometer with dual fluorescence – Auto 2000, K2 or Vision – just 20 µl of sample is added to the Cellometer Counting Chamber. Imaging and analysis of the samples is completed in less than 60 seconds. Bright field and fluorescent cell images can be viewed to check cell morphology and verify cell counting. Total cell count, concentration, and mean diameter are automatically displayed.
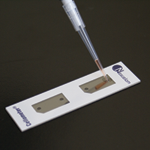
1. Pipette 20 µl of sample into a disposable slide.
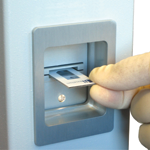
2. Insert slide into the instrument
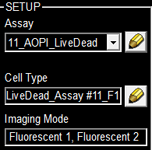
3. Select assay from a drop down menu
4. Click count, acquire image and view cell count, concentration, diameter
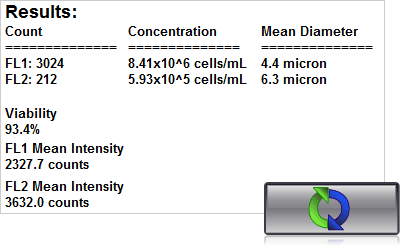
Detection of Immunological Cell Samples Using Cellometer Auto 2000
Simple, User-friendly Cellometer Procedure

Click edit button to change this text.1. Pipette 20µl 2. Insert Slide 3. Select Assay & Click Count
4. Results in 30 seconds!
Human Clinical Samples
Bone Marrow (BM)
Bone Marrow (BM) is a complex tissue that is the site of hematopoiesis and B-cell development. Multipotent, non-hematopoietic stem cells, such as mesenchymal stem cells, may be isolated from human bone marrow. Furthermore, bone marrow mononuclear cells (MNCs) can be isolated by diluting the bone marrow sample and performing a density gradient separation. After centrifugation, the MNC layer is collected and may be further processed to isolate various subpopulations (hematopoietic progenitor cells, mesenchymal stem cells, CD33+ myeloid cells, and CD138+ plasma cells) using cell sorting.
Current Issue: Sample contamination with red blood cells may lead to inaccurate enumeration of immune cells.
Current Solution: Lyse red blood cells prior to cell count.
Nexcelom Solution: Perform fluorescent based analysis. Using AO/PI allows for the identification, enumeration of mononuclear cells, as well as provides cell viability in the counted sample.
Bone marrow samples can be processed and used for many different experimental applications such as studying hematopoietic cell differentiation pathways and acting as controls for BM malignancies studies.
Total Nucleated Cells in Bone Marrow Measured Using AO
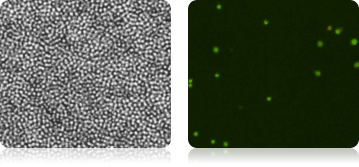
Isolated Mononuclear Cells Stained with AOPI
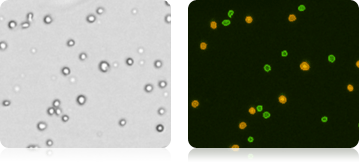
Bone Marrow Stem Cells Satined with AOPI
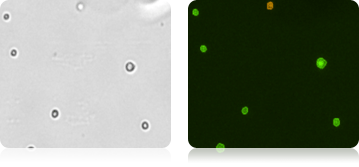
In a separate experiment, three individual human bone marrow samples were stained with AOPI, imaged and analyzed. Acquired bright-field (BR) images were counted separately from the acquired AOPI (F1F2) images. As shown in the table (right), many more particles were counted in the BR than in F1+F2. Since the count of F1F2 to BR are not 1:1, the ratio of FL /BR reflect those counts. Furthermore, the tabulated ratios in the three separate experiments are shown to be different from experiment to experiment. The ratio variation is the direct results of imaging of non-nucleated particles in bright-field. Due to the complex nature of the sample, we conclude that counting nucleated cells in a bone marrow samples should be performed using AOPI staining.
| F1F2 | BR | Ratio FL / BR | Viability | |
|---|---|---|---|---|
| MNC-BM_1 | 3296 | 4575 | 0.72 | 98.20% |
| MNC-BM_2 | 1388 | 1605 | 0.86 | 98.60% |
| MNC-BM_3 | 2008 | 2935 | 0.68 | 98.20% |
Cord Blood (CB)
Cord blood (CB) is collected at the time of delivery in a 250 mL standard blood bag containing anti-coagulating agents. CB-Mononuclear Cells (MNC) can be isolated by diluting the cord blood sample and performing a density gradient separation. After centrifugation, the MNC layer is collected and can be further processed to isolate subpopulations (hematopoietic progenitor stem cells, CD34+ neutrophils, CD14+ monocyte, CD19+ B cells, CD3+, CD4+, CD8+ T cells, and CD56+ NK cells) using cell sorting.
Cord blood samples can be processed and used for many different experimental applications such as treatment of hematopoietic, genetic and SCID (severe combined immunodeficiency) disorders.
Total Live and Dead Cells in Cord Blood Measured Using AOPI
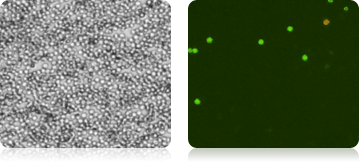
Isolated Mononuclear Cells Stained with AOPI
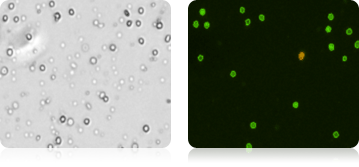
Bone Marrow Stems Cells Stained with AOPI
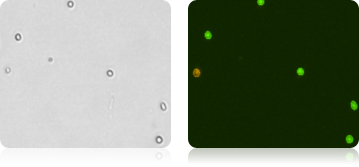
Five human cord blood samples were stained with AOPI and imaged. Acquired bright-field (BR) images were counted separately from the acquired AOPI (F1F2) images. As shown in the table (right), many more particles were counted in the BR than in F1+F2. The ratios of FL to BR show that in almost every sample there was more than double the amount of particles counted in BR compared to AOPI. Variability in ratios stems from counting non-nucleated particles in bright-field. We conclude that counting nucleated cells in complex samples such as cord blood should be performed using AOPI.
| F1F2 | BR | Ratio FL / BR | Viability | |
|---|---|---|---|---|
| MNC-CB_1 | 2488 | 4659 | 0.53 | 98.10% |
| MNC-CB_2 | 2613 | 7152 | 0.37 | 94.10% |
| MNC-CB_3 | 2313 | 5791 | 0.40 | 93.30% |
| MNC-CB_4 | 1939 | 3449 | 0.56 | 96.70% |
| MNC-CB_5 | 2243 | 6450 | 0.35 | 95.80% |
Human Peripheral Blood (aka Whole Blood)
Human peripheral blood (aka whole blood) is collected from a patient into a vial containing anti-coagulating agents. Whole blood is a rich source of diverse mononuclear cells. Subpopulations of nucleated cells (progenitor cells, B cells, T cells, dendritic cells, natural killer cells, neutrophils, red blood cells, platelets, monocytes, macrophages) can be isolated and purified using various isolation techniques.
Cord blood samples can be processed and used for many different experimental applications such as: an early detection tool for different diseases, studying metabolism and immunity pathways, and discovery of potential therapeutic antibodies.
Total Number Nucleated Cells in Whole Blood Measured Using AO
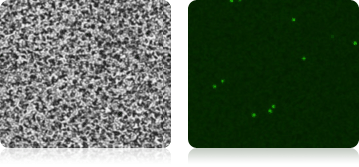
Isolated Mononuclear Cells Stained with AO
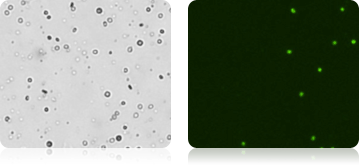
Purified CD19+ B Cells Stained with AOPI
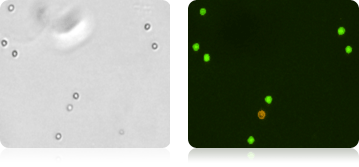
Isolated Neutrophils Cells Stained with AOPI
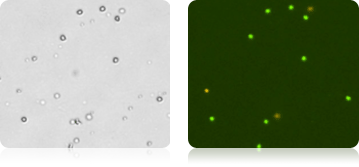
NK Cells CD56+ Stained with AOPI
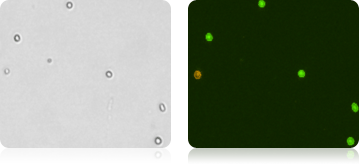
HPC (Human Hematopoietic Cells)
HPC (Human hematopoietic cells) Human hematopoietic primary cells are isolated from peripheral blood, bone marrow or cord blood.
CD34+ Stem Cells Stained with AOPI
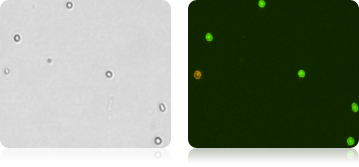
Murine Samples
Murine primary cells. Murine animal models are widely utilized to study different human diseases. A great variety of samples are regularly collected and processed. Obtaining a cell count and viability are two common processes that are part of standard laboratory practices.
Current Issue: During standard harvests, the processing of numerous samples very time consuming. Furthermore, due to a great variety of potential samples multiple methods may be needed to determine cell count and viability.
Current Solution: Hemocytometer counting.
Nexcelom Solution: Perform fluorescent based analysis. Using AO/PI allows for the identification, enumeration, and provides cell viability of nucleated cells in the collected sample. This procedure may be performed on many different collected samples.
A large immunological study was performed where 30 individual samples of mouse lymphocytes and splenocytes were collected and processed on the same day. Each sample was stained with AO/PI and imaged using a Cellometer Auto 2000. The total cell count, concentration and viability were acquired for all of the samples.
| Lym7 | Lmy6 | Lym2 | Lym 5 | |
|---|---|---|---|---|
| Total cell count | 49 | 1419 | 10635 | 24245 |
| Live cell concentration | 1.07E+05 | 2.84E+06 | 3.11E+07 | 6.75E+07 |
| Viability | 63.20% | 58.00% | 84.40% | 80.30% |
| Bright field cell image | 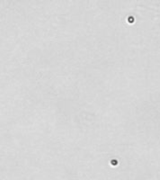 |
 |
 |
 |
| Counted live /dead cell image |  |
 |
 |
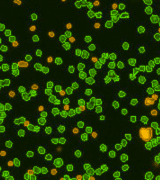 |
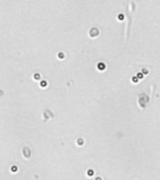
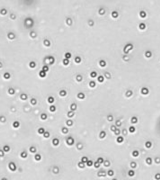
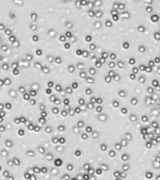
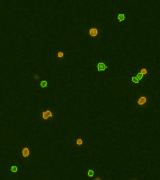
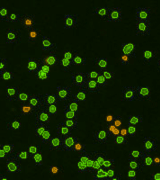
Above, is the representative set of 4 different mouse lymphocyte samples (Lym7, 6, 2, 5). A bright-field and a counted fluorescent image are shown for each sample. The samples ranged in concentration from 1.07x10⁵ (with 49 cells counted) to 6.75×10⁷ (with 24245 cells counted) and viability of samples ranged from 58.0% to 84.4%. Because images can be saved during data acquisition, they can be used for documentation and visual verification of counted cells.
Below, are the tables containing the data for each of the 30 collected and processed lymphocyte and splenocyte samples. Reported below are the cell counts, concentrations, and viability for live cells. The same imaging and counting parameters were used for all samples. Total imaging time for all 60 samples was approximately 30 minutes compared to total counting time using a hemocytometer was approximately 2 hours.
| Sample ID | Cell count | Concentration | Viability |
|---|---|---|---|
|
Ln 1
|
5627
|
1.94E+07
|
83.60%
|
|
Ln 2
|
9283
|
3.20E+07
|
84.30%
|
|
Ln 3
|
11694
|
4.03E+07
|
83.20%
|
|
Ln 4
|
8320
|
2.87E+07
|
82.90%
|
|
Ln 5
|
21310
|
7.35E+07
|
81.60%
|
|
Ln 6
|
608
|
2.09E+06
|
49.90%
|
|
Ln 7
|
19
|
6.55E+04
|
52.70%
|
|
Ln 8
|
5944
|
2.05E+07
|
81.50%
|
|
Ln 9
|
1383
|
4.78E+06
|
71.60%
|
|
Ln 10
|
3968
|
1.37E+07
|
75.20%
|
|
Ln 11
|
1641
|
5.66E+06
|
69.90%
|
|
Ln 12
|
12408
|
4.28E+07
|
84.90%
|
|
Ln 13
|
1456
|
5.02E+06
|
76.40%
|
|
Ln 14
|
2168
|
7.47E+06
|
76.30%
|
|
Ln 15
|
3912
|
1.35E+07
|
80.30%
|
|
Ln 16
|
3876
|
1.34E+07
|
80.00%
|
|
Ln 17
|
3836
|
1.32E+07
|
79.80%
|
|
Ln 18
|
2008
|
6.92E+06
|
70.60%
|
|
Ln 19
|
1940
|
6.68E+06
|
68.50%
|
|
Ln 20
|
1535
|
5.29E+06
|
66.90%
|
|
Ln 21
|
2103
|
7.25E+06
|
72.00%
|
|
Ln 22
|
9048
|
3.12E+07
|
80.30%
|
|
Ln 23
|
2607
|
8.99E+06
|
71.80%
|
|
Ln 24
|
8240
|
2.84E+07
|
79.10%
|
|
Ln 25
|
3571
|
1.23E+07
|
75.50%
|
|
Ln 26
|
10520
|
3.62E+07
|
81.80%
|
|
Ln 27
|
6069
|
2.09E+07
|
82.40%
|
|
Ln 28
|
5913
|
2.04E+07
|
74.50%
|
|
Ln 29
|
6457
|
2.22E+07
|
74.00%
|
|
Ln 30
|
6296
|
2.17E+07
|
78.40%
|
| Sample ID | Cell count | Concentration | Viability |
|---|---|---|---|
|
Sp 1
|
3840
|
1.32E+07
|
58.40%
|
|
Sp 2
|
6322
|
2.18E+07
|
64.80%
|
|
Sp 3
|
4055
|
1.40E+07
|
63.60%
|
|
Sp 4
|
4990
|
1.72E+07
|
58.70%
|
|
Sp 5
|
8204
|
2.82E+07
|
62.80%
|
|
Sp 6
|
7704
|
2.65E+07
|
60.20%
|
|
Sp 7
|
8209
|
2.83E+07
|
79.90%
|
|
Sp 8
|
8999
|
3.10E+07
|
59.90%
|
|
Sp 9
|
7870
|
2.71E+07
|
69.30%
|
|
Sp 10
|
7894
|
2.72E+07
|
69.30%
|
|
Sp 11
|
3967
|
1.37E+07
|
63.80%
|
|
Sp 12
|
2659
|
9.19E+06
|
72.30%
|
|
Sp 13
|
1329
|
4.58E+06
|
61.40%
|
|
Sp 14
|
1290
|
4.45E+06
|
60.60%
|
|
Sp 15
|
2215
|
7.64E+06
|
60.70%
|
|
Sp 16
|
2222
|
7.66E+06
|
60.60%
|
|
Sp 17
|
5199
|
1.79E+07
|
70.50%
|
|
Sp 18
|
1895
|
6.53E+06
|
74.40%
|
|
Sp 19
|
1769
|
6.09E+06
|
60.50%
|
|
Sp 20
|
3532
|
1.22E+07
|
59.50%
|
|
Sp 21
|
1972
|
6.79E+06
|
67.70%
|
|
Sp 22
|
1764
|
6.08E+06
|
62.40%
|
|
Sp 23
|
2020
|
6.96E+06
|
64.60%
|
|
Sp 24
|
1156
|
3.98E+06
|
64.90%
|
|
Sp 25
|
1244
|
4.28E+06
|
60.00%
|
|
Sp 26
|
3884
|
1.34E+07
|
76.70%
|
|
Sp 27
|
1728
|
5.96E+06
|
69.80%
|
|
Sp 28
|
2136
|
7.36E+06
|
65.10%
|
|
Sp 29
|
2112
|
7.29E+06
|
67.90%
|
|
Sp 30
|
1080
|
3.72E+06
|
65.70%
|
Mouse Tail Vein Blood

Mouse Lymph Node

Mouse Dendritic Cells

Mouse Digested Ear

Mouse Splenocytes

Tumor Digest
digest samples are collected from the patient at the primary source of the tumor. Solid tumors first need to be digested and processed before they can be utilized in experiments.
Current Issue: Tissue digest are inherently messy samples. They may contain tissue fragments and cellular debris making it difficult to identify and count cells of interest.
Current Solution: Spin-out debris and wash sample multiple times. Isolate cells of interest by magnetic bead separation technique.
Nexcelom Solution: Perform fluorescent based analysis. AO/PI staining allows for the identification, enumeration, and provides cell viability of nucleated cells in the collected sample.
Examples of Tumor Digests
Human Melanoma Digest Sample Stained with AOPI

Bright field image, AO/PI image & bright field and AO/PI overlay image
Murine Tumor Digest Samples Stained with AO/PI


Bright field and AO/PI overlay images (far right) show the labeling of nucleated cells only.
Tumor Cells with Lymphocytes
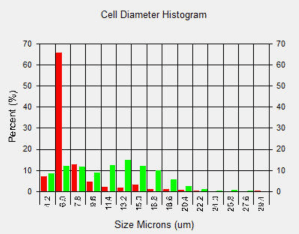
Bright Field and Fluorescent Images of Lymphocyte and Tumor Cell Mixture Stained with AO/PI
Lymphocytes were added to a suspension of tumor cells and stained with AO/PI. The sample data was acquired and images automatically analyzed. The cell diameter histogram shows that there are two distinct populations in our sample: one (in red) is the smaller ~6.0 microns in diameter and the other (in green) are the tumor cells averaging about 13 micron in diameter.
Bronchoalveolar Lavage (BAL)
Bronchoalveolar lavage (BAL) is a medical procedure in which a bronchoscope is passed through the mouth or nose into the lungs and fluid is squirted into a small part of the lung and then recollected for examination. BAL sample may contain lung and bronchial epithelial cells, macrophage, lymphocytes, and other immune cells. BAL samples from humans or mouse may be analyzed on the Cellometer.
Current Issue: BAL samples contain cellular debris making it difficult to identify and count cells of interest.
Current Solution: Upon isolation and purification of immune cells, flow cytometry or manual counting is used to count the cells.
Nexcelom Solution: Perform fluorescent based analysis. Using AO/PI allows for the identification, enumeration, and provides cell viability of nucleated cells in the collected sample.
Examples of Bronchoalveolar Lavage Samples


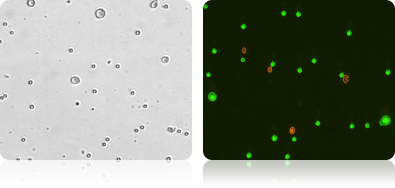
These murine BAL samples were collected from multiple individual experiments. Each sample was stained with AO and imaged. Above is a collection of bright-field, AO fluorescent (FL), and BR-FL overlay images.
Counting PBMC Samples
- Analysis of peripheral blood mononuclear cells is similar to analysis of nucleated cells from bone marrow, cord blood, or whole blood
- Current PBMC enumeration method using hemacytometer and light microscopy can include donor-dependent RBC-induced counting error
- Cellometer image cytometer was used to eliminate the RBC-induced counting error by automatically enumerate AO/PI-stained nucleated cells
Conclusions & Cellometer Selection Guide
Clinical primary samples are routinely used for biology, immunology, and cancer research. The diversity and the quantity of the samples often poses a challenge of counting and calculating the concentrations and viability of samples in a time efficient and accurate manner. The family of Cellometer instruments provides researchers multiple tools to perform fast and consistent counts of nucleated cells. Fluorescent staining of blood-based and primary samples allows for accurate identification and enumeration of nucleated cells even in the presence of potential contaminants. The chart below provides a quick reference guide to which Cellometer may be right for your lab!
Give us a call 978-327-5340. Experienced Nexcelom Applications Specialists are available 8:30am to 5:30pm EST to assist with selection of a Cellometer system.
| Cellometer Mini | Cellometer Auto T4 | Cellometer Auto 1000 | Cellometer Auto 2000 | Cellometer Vision / Vision CBA | |
|---|---|---|---|---|---|
| Purified cells– no debris | |||||
| Isolated MNCs – without lysing RBCs | |||||
| Fresh BM, CB, WB, MNCs w/ lysing of RBCs | |||||
| Fresh BM, CB, WB without lysing | |||||
| Frozen BM, CB, WB | |||||
| Digested tumors and BAL with tissue/cellular debris |
= excellent
= very good
= good
= not recommended BM = Bone Marrow, CB = Cord Blood, WB = Whole Blood, MNCs = Mononuclear cells
Publications Using Cellometer for Immunology Research
- Singh H, Figliola MJ, Dawson MJ, et al. Reprogramming CD19-specific T cells with IL-21 signaling can improve adoptive immunotherapy of B-lineage malignancies. Cancer Research 2011, 15(10):3516-27
- Chan LL, Zhong XM, Pirani A, Lin B. A novel method for kinetic measurements of rare cell proliferation using Cellometer image-based cytometry. Journal of Immunological Methods 2012, 377(1-2):8-14
- Holmuhamedov EL, Czerny C, Beeson CC, Lemasters JJ. Ethanol Suppresses Ureagenesis in Rat Hepatocytes: role of acetaldehyde. Journal of Biological Chemistry 2012, 287(10):7692-7700
- Ranguelova K, Rice AB, Khajo A, Triquigneaux M, Garantziotis S, Magliozzo RS, Mason RP. Formation of reactive sulfite-derived free radicals by the activation of human neutrophils: An ESR study. Free Radical Biology & Medicine 2012, 52:1264-1271
- Lugli E, Gattinoni L, Roberto A, Mavilio D, Price DA, Restifo NP, Roederer M. Identification, isolation and in vitro expansion of human and nonhuman primate T stem cell memory cells. Nature Protocols 2012, 8(1):33-42
- Lo Surdo J, Bauer SR. Quantitative Approaches to Detect Donor and Passage Differences in Adipogenic Potential and Clonogenicity in Human Bone-Marrow-Derived Mesenchymal Stem Cells. Tissue Engineering Part C Methods 2012, 18(11):877-89
- Chan LLY, Laverty DJ, Smith T, Nejad P, Hei H, Gandhi R, Kuksin D, Qiu J. Accurate measurement of peripheral blood mononuclear cell concentration using image cytometry to eliminate RBC-induced counting error. Journal of Immunological Methods 2013, 388(1-2):25-32
- Yang B, Pham TH, et al. Accurate and Simple Measurement of the Pro-inflammatory Cytokine IL-1β using a Whole Blood Stimulation Assay. Journal of Visual Experimentation 2011 1(49)
