Cytopathic effects of encephalomyocalditis virus (ECMV) on baby hamster kidney cells (BSR)
The BSR host cells are seeded in a 96-well plate and allowed to reach 100% confluence in the wells. The host cells are then infected with ECMV and a mock virus at 1:10 titrations following the plate map shown below. After the incubation, the monolayer of cells is fixed and stained with crystal violet. As the virus concentration increase, the host cells are killed and reducing the monolayer in the wells. The Celigo automatically quantifies the percentage of host cells remaining in each well which, in this example, contain serial dilutions of ECMV.

Plate map showing host cells infected with ECMV and a mock virus at 1:10 titrations

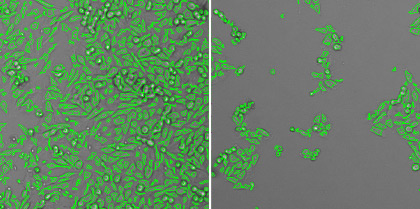
Virus concentration-dependent CPE response showing a reduction in host cell confluence as virus concentration increases. From left, monolayer remaining is 99%, 40% and 10%.

Celigo generated heat-map for immediate viewing of trends and reproducibility

The confluence % data can be plotted to produce viral titer curves and determine TCID50s
Example CPE measurement performed using the Celigo Image Cytometer:
CPE of encephalomyocalditis virus (ECMV) on baby hamster kidney cells (BSR)
Example CPE measurement performed using the Celigo Image Cytometer:
CPE of encephalomyocalditis virus (ECMV) on baby hamster kidney cells (BSR)
The Celigo Image Cytometry system performs high-througput, whole-well imaging and quantitative data in bright field and up to four fluorescent channels for a wide variety of cell-based assays.
Learn more about modern virology assays: