| Purpose | Validate wound healing migration assay with OrisTM Platypus plate on Celigo |
| Existing Method(s) | Plate Reader absorbance reading |
| Target Cell Type | HT1080 |
| Experiment Plan | Plate cells in OrisTM Platypus Plate, remove plugs, add drug, image after 32 hours. |
| Hypothesis | Inhibit cell migration (wound healing) with Cytochalasin D drug addition. |
Celigo Setup
| Plate Type | 96-well Platypus Oris™ Cell Migration Assay Plate Cat# CMA1.101 Black wall, clear bottom |
| Scan Channels | Brightfield channel |
| Resolution | 1 µm/pixel |
| Scan Area | Whole well |
| Analysis Method | Wound Healing |
| Scan Frequency | Once |
| Scan Time | Less than 10 minutes |
Assay Protocol and Plate Setup
Goal:
Measure the migration of drug-treated adherent HT1080 cells using 96-well Oris™ Platypus plates
Protocol:
Cell Preparation
- Adherent cells (HT1080) were plated in Oris™ plate with plug and allowed to adhere overnight.
- The plug was removed and drug was added to wells.
- The plate was imaged at 32 hours post-treatment. 4. Cell counts and confluence area were reported.
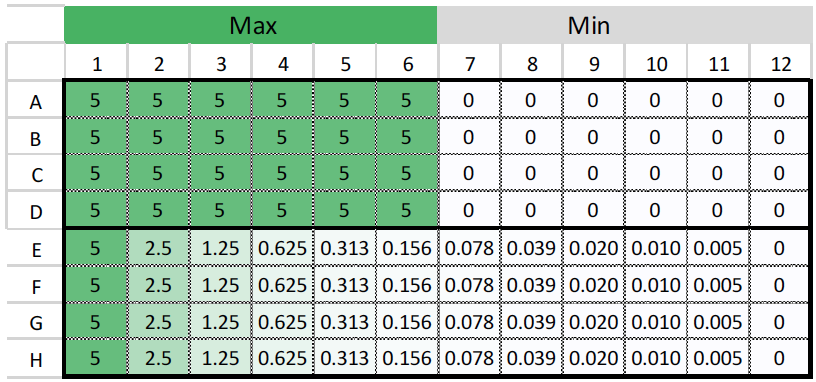
Plate map of Cytochalasin D (µM) treatment
Data Collection
- Imaged whole well and whole plate at 32 hours post-drug treatment with Wound Healing Application in Brightfield channel in less than 10 minutes.
Data Analysis
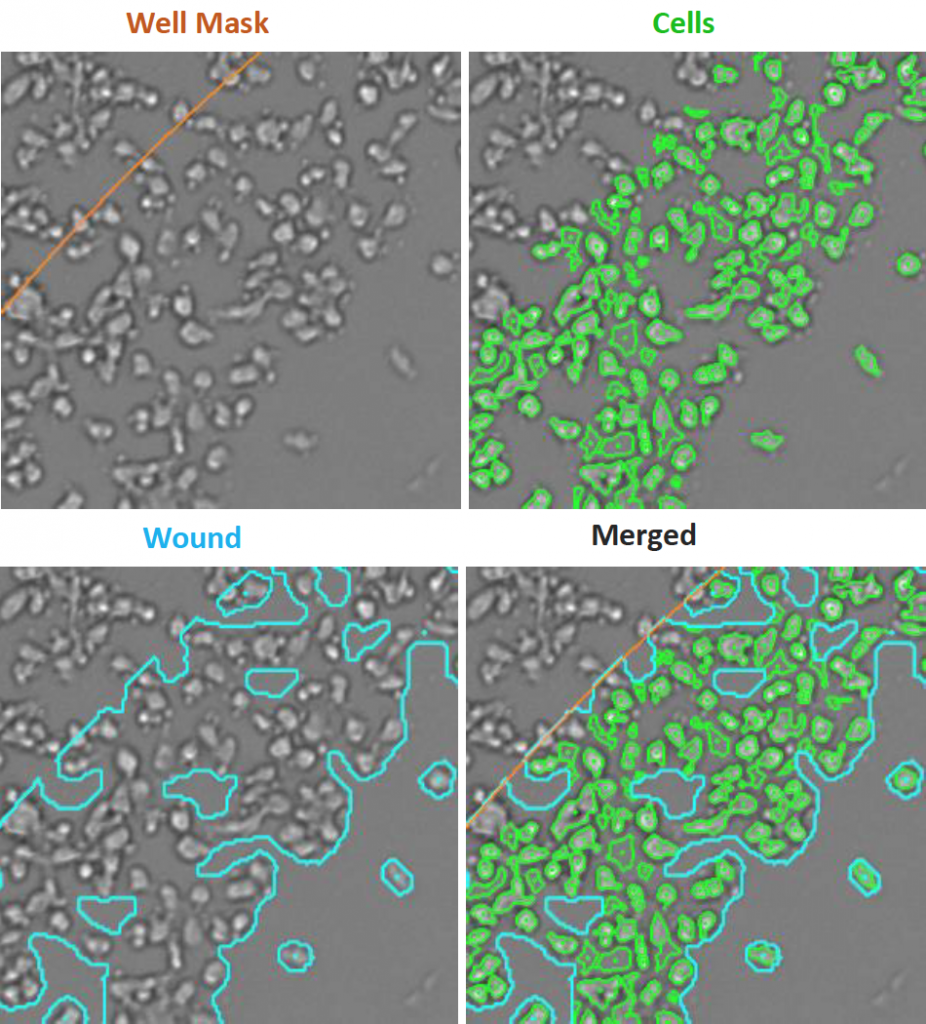
- Analysis Graphic overlays for cells, wound and well mask showed that wound area and cell counts were properly detected. The well mask was decreased to focus analysis locally on the area of the wound created by the plug.
Results
Celigo
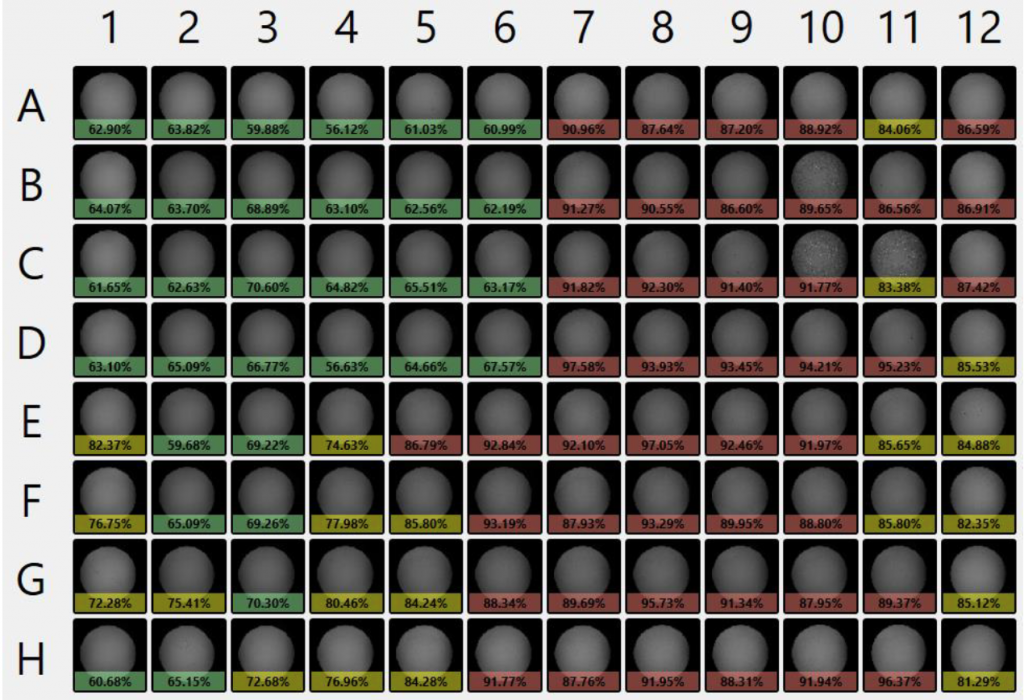
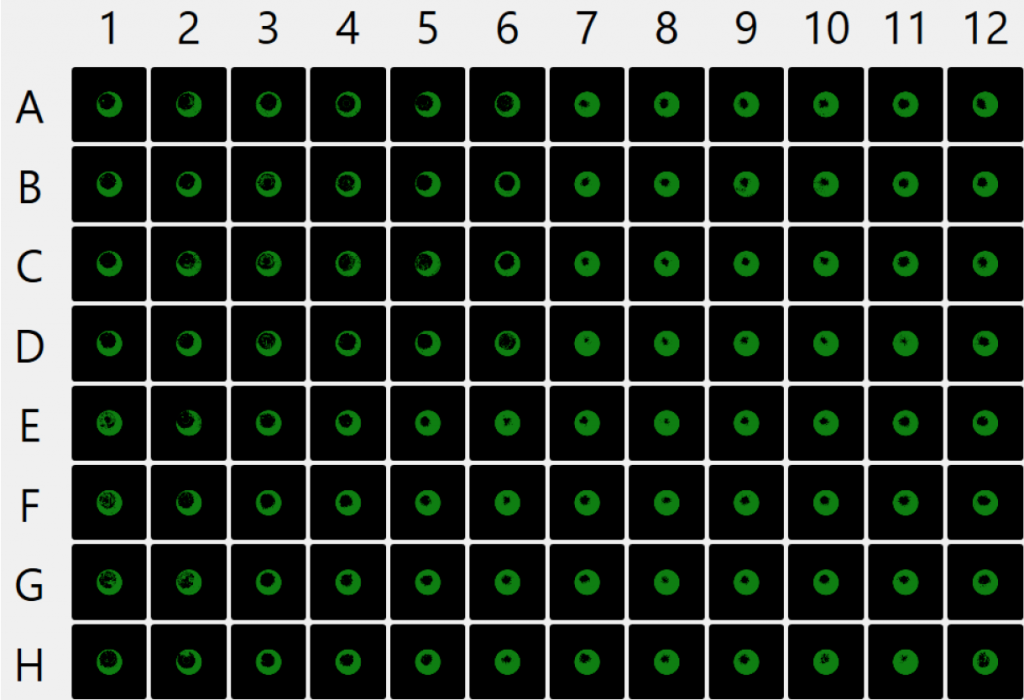
- Whole plate results showed data colored with “heatmap” feature to show high, medium, and low values in Image view (top) and Fill view (bottom) pseudo-color filling in area of cells detected in image.
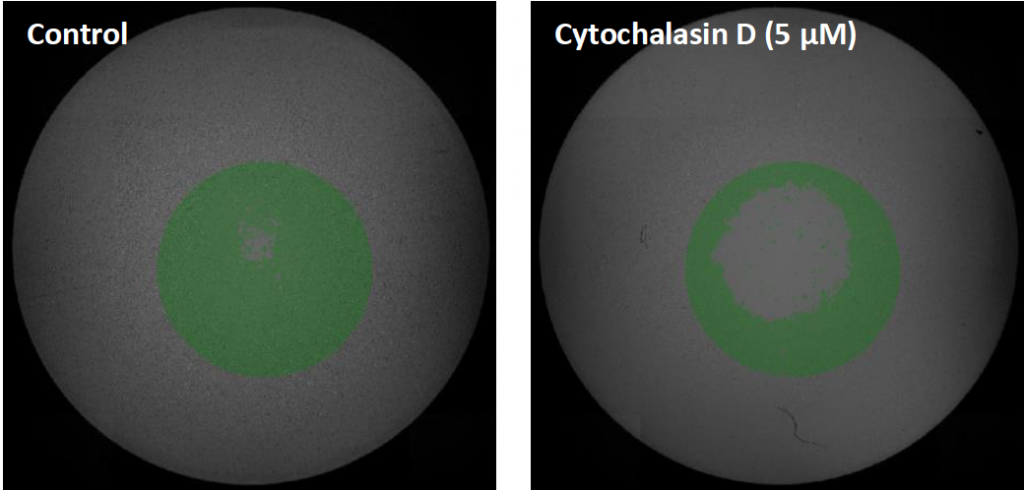
- Well Level results showed Control (left) and Cytochalasin D treated wells after 32 hours (right) with fill view (green).
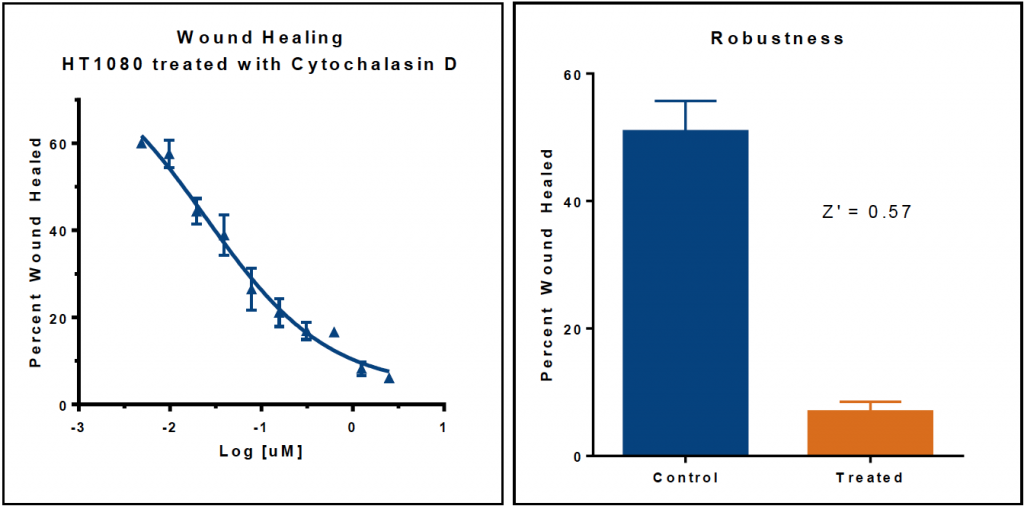
- Dose-response curve and robustness Z factor for Cytochalsin D treatment
Conclusion
- Cell migration (wound healing) assay with HT1080 cells plated in the Oris™ Platypus plate was imaged and analyzed on Celigo in less than 10 minutes.
- The Celigo-generated data reported cell counts and wound healing area for each well over a drug course treatment. The Celigo image cytometer produced a more comprehensive image and quantification data than a plate reader.
- Dose-response curve and robustness factor (Z’) calculated to show robustness and can be performed in order to validate this assay for use in your lab.