| Purpose | Measure the effects of a panel of drugs on the viability of U87MG Glioblastoma MCTS using calcein AM and Propidium Iodide fluorescent staining |
| Existing Method(s) | Microscopy |
| Target Cell Type | U87MG (Glioblastoma) |
| Experiment Plan | Allow U87MG spheroids to form and treat with a panel of drug compounds, then image on day 13 to measure the cytotoxicity effects of the compounds |
| Hypothesis | Using the bright field and fluorescent imaging, the Celigo will rapidly provide multicellular tumor spheroid images, and measure calcein AM and PI fluorescent intensities of treated U87MG MCTS |
Celigo Setup
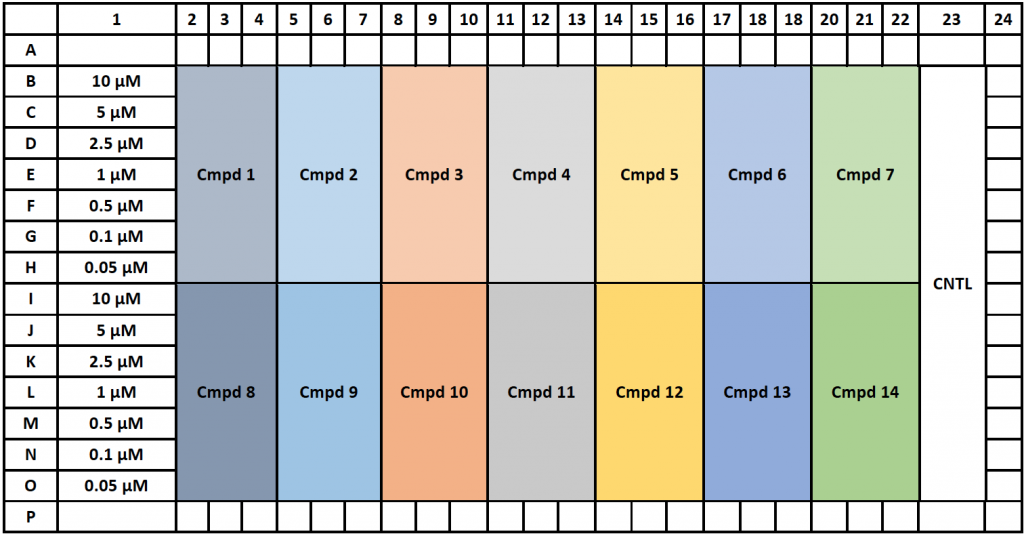
| Plate Type | Nexcelom U-bottom Ultra-low Attachment 384-well Plate (Cat# ULA-384U) |
| Scan Channels | Green, Red, and Bright Field |
| Resolution | 1 µm/pixel |
| Scan Area | Whole well |
| Analysis Method | Tumorsphere 1 + 2 + Mask |
| Scan Frequency | End point |
| Scan Time | ~8 min |
Assay Protocol and Plate Setup
Goal:
Image and analyze the cytotoxicity effects of a panel of drug compounds on U87MG MCTS on day 13.
Protocol:
Cell Preparation
- Seeded 500 U87MG cells/well in ULA 384-well plates
- On day 4, added different diluted drug compounds at 2x and a vehicle control in media
- On day 13, prepared the calcein AM and PI for staining the MCTS
- Incubated the plate at 37 °C and 5% CO2 for 60 min
- Imaged and analyzed on Celigo 6. Compared the spheroid viability for each drug compound at each time point to characterize the tested compounds
Data Collection
- After incubating the spheroids with drugs at different concentrations, the spheroids were stained with calcein AM and PI
- The plate with stained spheroids was imaged on day 13
- The captured images were then analyzed in the Celigo software for the entire 384-well plate
Data Analysis
- The images were analyzed by using Tumorsphere 1 + 2 + Mask application to identify the MCTS in the well
- The fluorescent intensities of calcein AM and PI were measured for each MCTS treated with drug compounds or control
Results
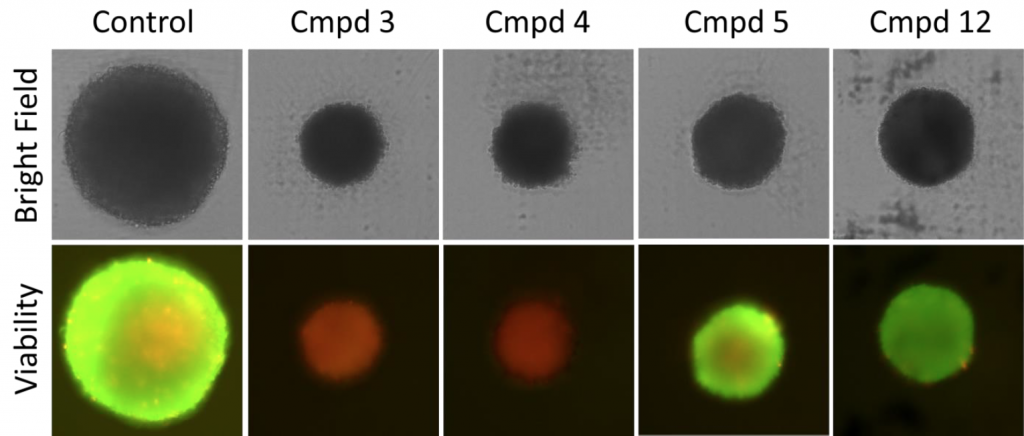
1. Endpoint bright field and fluorescent images and results of MCTS for control and treated sample
- The bright field images were used to identify the spheroids in each well
- The calcein AM and PI fluorescent intensities were measured from the images
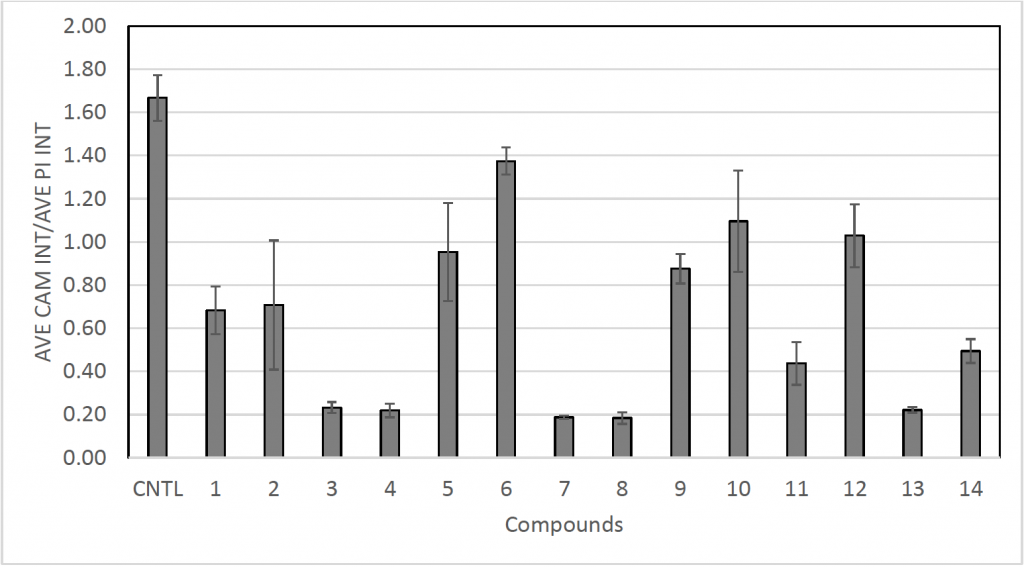
- Calcein AM/PI intensity ratios were calculated to determine the viability
- Compound 3 and 4 were highly cytotoxic to the tumor spheroids, while compound 5 and 12 reduced the size of the spheroids but did not induce cytotoxicity
- The plot below shows the calcein AM/PI fluorescent intensity ratios, which indicate the viability of each MCTS treated with the different drug compounds
- Few drug compounds had moderate to high cytotoxic effects on the U87MG MCTS, while other drugs had no effects
- In addition to viability measurements, the spheroid size can also indicate some cytotoxicity or growth inhibition effects from the drug compounds
Conclusion
- Using the 384-well U-bottom ULA plates, we successfully captured images of U87MG MCTS and analyzed the data using the Celigo instrument
- The entire 384-well plate was imaged in ~8 min. The short scan time significantly increased the throughput during the experiment which had multiple plates
- After the drug treatments, the spheroids’ calcein AM and PI fluorescent intensities were measured and automatically reported by the Celigo software
- No additional software was required for image analysis of MCTS fluorescent intensities
- The ability to measure fluorescence from viability stains, in combination with spheroid size, allowed researchers to understand the effects of drugs on a spheroid level, where enzymatic readout using a plate reader might not provide