| Purpose | Kinetically monitor multicellular tumor spheroid (MCTS) growth & Propidium Iodide (PI) dead cell signal on U87MG Glioblastoma over multiple days |
| Existing Method(s) | Microscopy as an endpoint assay, third-party analysis |
| Target Cell Type | U87MG |
| Experiment Plan | Allow U87MG spheroids to form with PI, then image for 10 days to measure the PI dead cell signal intensity and growth of spheres |
| Hypothesis | Using bright field and fluorescent imaging, Celigo will provide an easy & rapid method to monitor multicellular tumor spheroid growth and PI dead cell signal intensities for U87MG MCTS. |
Celigo Setup
| Plate Type | Nexcelom U-bottom Ultra-Low Attachment 96-well plate (Cat# ULA-96U) |
| Scan Channels | Bright field (BF), Red |
| Resolution | 1 µm/pixel |
| Scan Area | Whole well |
| Analysis Method | Tumorsphere 1 + Mask |
| Scan Frequency | Every 24 hours |
| Scan Time | ~2 minutes |
Assay Protocol and Plate Setup
Goal:
Monitor the spheroid growth and intensity of PI in U87MG MCTS for 10 days
Protocol:
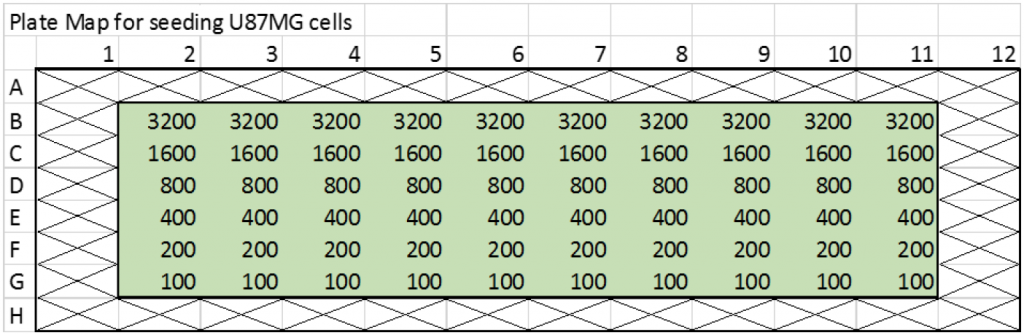
- Seeded different cell numbers from 3,200 to 100 U87MG cells/well in a ULA U-bottom 96-well plate
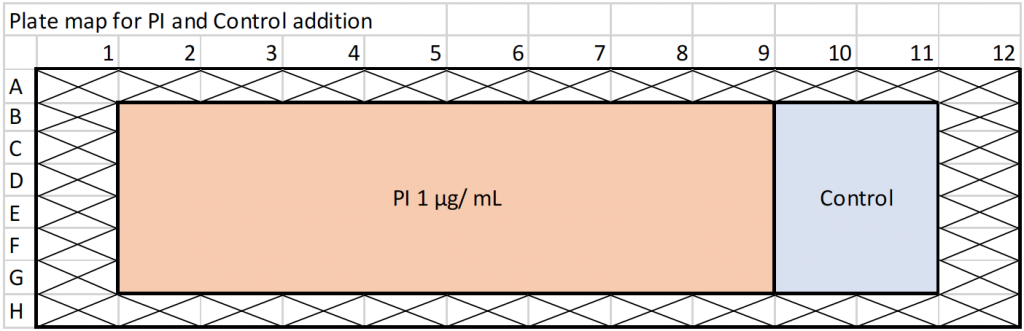
- Added 2X PI staining solution and vehicle control in media to the appropriate wells
- Incubated the plate at 37 °C and 5% CO2
- Imaged and analyzed on Celigo for 10 days
- Analyzed the PI intensities and size of the spheres for 10 days
Data Collection
- After forming MCTS with PI, the plate was imaged in BF and Red illuminations and analyzed daily for 10 days. Each scan took ~ 2 minutes.
Data Analysis
- The images were analyzed by using Tumorsphere 1 + Mask application
- The PI fluorescent intensities and sphere diameters were measured for the MCTS
Images Results
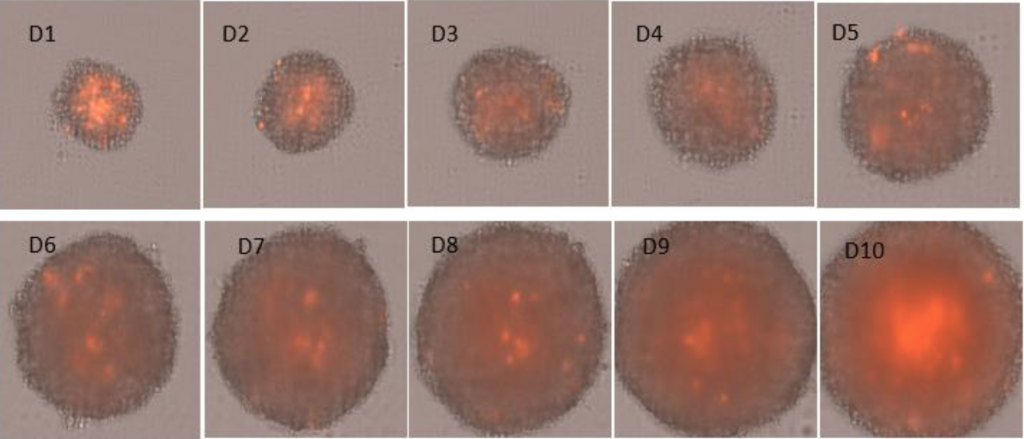
Figure 1. Bright field and red fluorescent images of U87MG MCTS with PI (red) over 10 days
Graph Results
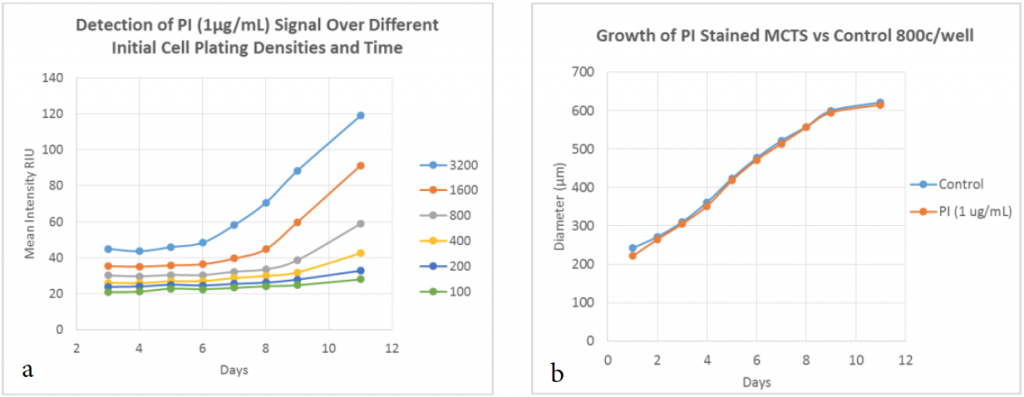
Figure 2. PI dead cell signal intensities and sphere diameters over 10 days.
Line graph showing the trends of PI intensity for different cell concentration for 10 days (a). Line graph showing that there is no toxic effect of PI on MCTS diameter (b).
Conclusion
- Using Celigo instrument, images of U87MG MCTS were successfully captured and analyzed for growth and PI dead cell signal intensities
- Adding PI at the beginning of the experiment allowed for kinetic monitoring of cell death in the core of the MCTS.
- As the sphere diameter began to plateau, the signal of PI increased
- The entire 96-well plate was imaged in 2 minutes. The short scan time significantly increased the throughput during an experiment that had multiple plates