| Purpose | To image and count whole-well populations of organoids in a rapid manner without having to take multiple, time consuming Z-stacked images |
| Current Method(s) | Manually, or Confocal Microscopy |
| Target Cell Type | Patient-derived intestinal differentiated cells (IDC) organoids |
| Experiment Plan | Organoids are cultivated in 6-well plates embedded in Matrigel and imaged in bright field |
| Hypothesis | Celigo will be able to perform rapid, whole-well imaging and analysis of organoids in a high throughput manner |
Celigo Setup
| Plate Type | Corning 12-well microplate |
| Scan Channels | Bright field |
| Resolution | 1 µm/pixel |
| Scan Area | Whole well |
| Analysis Method | Tumorsphere 1 |
| Scan Frequency | Once |
| Scan Time | ~8 min |
Assay Protocol and Plate Setup
Goal:
To image and count whole-well populations of organoids in a rapid manner without having to take multiple, time consuming Z-stacked images
Protocol:
IDC Organoids Preparation
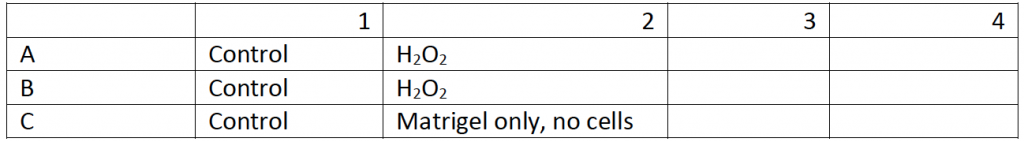
- IDC organoids were cultivated in 12-well microplates and embedded in Matrigel following the plate map below
- Next, the organoids were grown for 20 days from IDC progenitor cells to form the organoids
- The organoids were also treated with H2O2 at time = 0, to inhibit the growth of the organoids
Data Collection
- The organoids images were captured using bright field imaging
- One of the Control wells was used to focus the organoids to set the focus Z-location
- The Celigo scan required approximately 5 min
Data Analysis
- The organoids were counted using Celigo application Tumorsphere 1
- The IDC organoids counts were generated, as well as the size of the organoids
Results
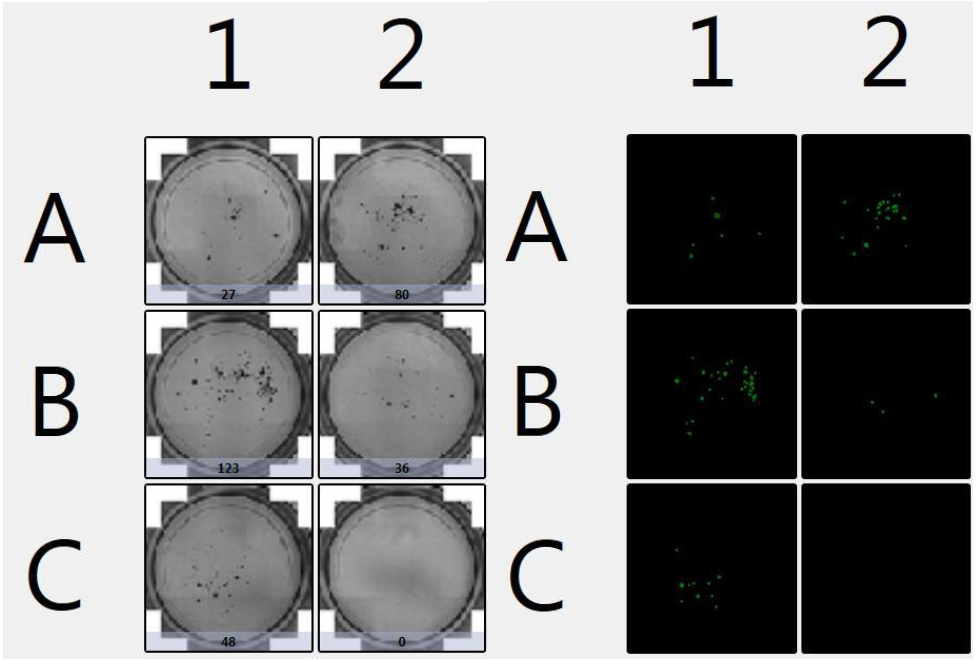
1. Celigo-captured bright field images of organoids
- Celigo captured bright field images in 12-well plates containing organoids in matrigel
- Below is an example whole plate image of the captured data
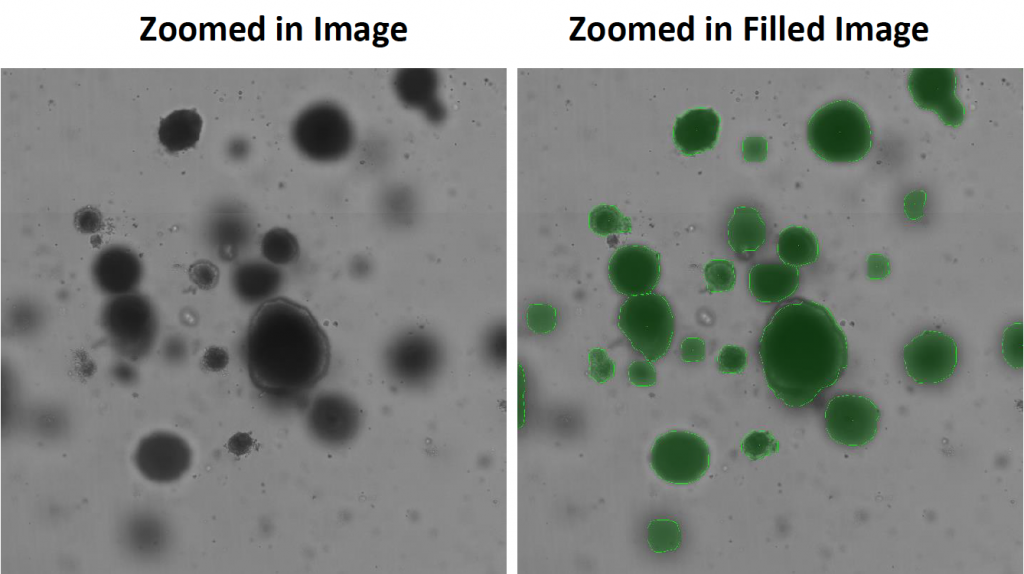
- Celigo captured high-resolution images in bright field that can be zoomed-in on from whole well (below)
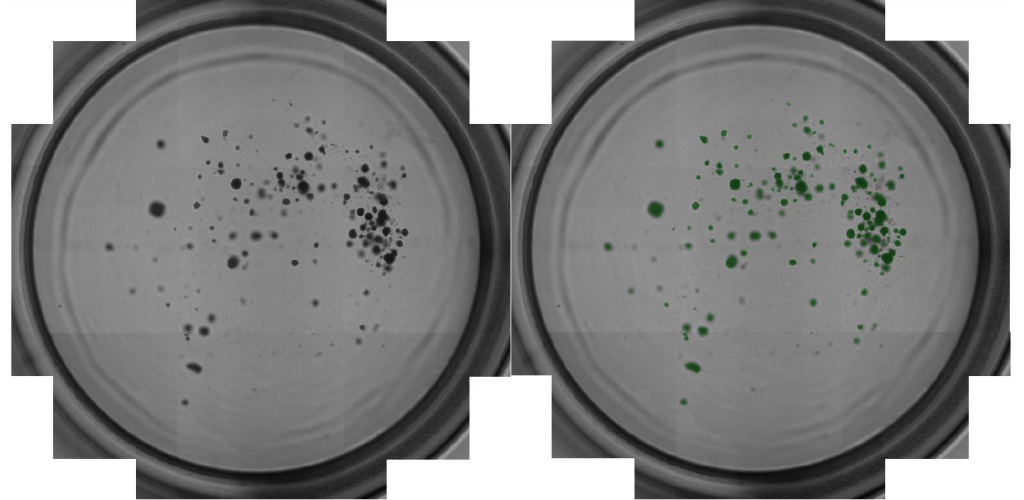
- The Celigo software accurately counted organoids and declustered them into individual organoids
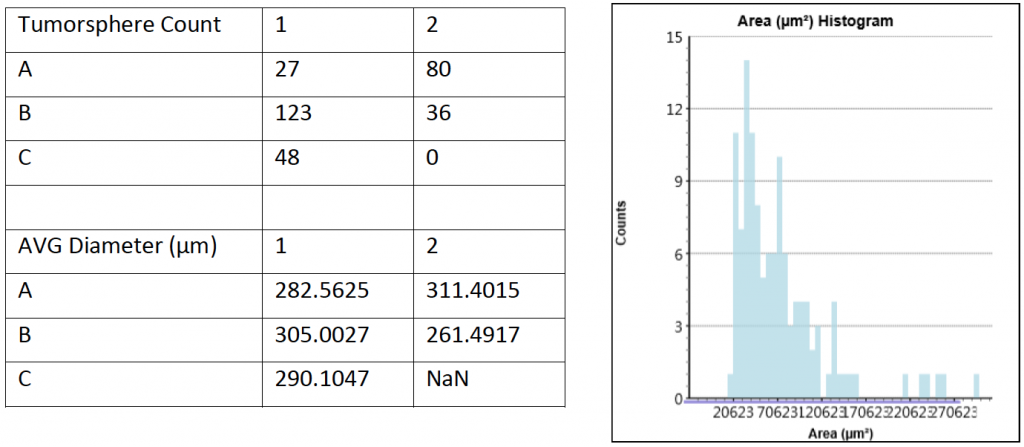
2. PDO Counting Results
- Celigo was used to count all the organoids in the 12-well plate
- The counted results and the size analysis of organoids are shown below
Conclusion
- Celigo was able to count the number of organoids directly in the wells and measured the diameter of each organoid
- Overall, there was no clear difference between the control and H2O2 treated samples
- Celigo software was able to decluster organoids in close proximity, to improve the counting accuracy of the current method