Jurkat cells were used to analyze cell cycle kinetics following treatment with the cell-cycle-arresting drug etoposide. Etoposide is designed to arrest the cells at the G2 phase of the cell cycle. Jurkat cells were incubated with media only (control) or etoposide (0.06 µM, 0.12 µM) for 24 hours. Control and drug-treated cells were ethanol fixed and stained with cell cycle propidium iodide reagent. For each sample, 20 µl of cell sample (at ~4 x 10⁶ cells / mL) was loaded into a Cellometer imaging chamber, inserted into the Vision CBA Analysis System, and imaged in both bright field and fluorescence. The fluorescence intensity for each cell was measured and a cell cycle histogram is automatically generated for each sample using the optimized Nexcelom cell cycle data layout in FCS Express 4 Flow Software. Gating can be manually optimized directly on the histogram with automatic update to the associated data table.
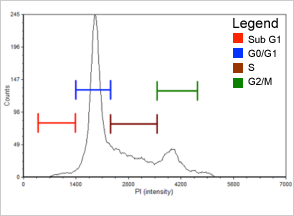
Figure 1. Control Population histogram for Jurkat control sample generated with FCS Express 4 software. As expected, most cells in this control sample are in the G0/G1 phase of the cell cycle. Representative data for this histogram is can be seen in Table 1.
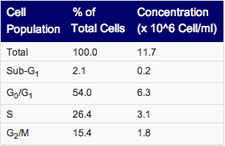
Table 1. Control Data Population distribution of Jurkat cells at different cell cycle phases. Nearly 55% of the gated cells are in the G0/G1 phase and are therefore, either resting or preparing to begin the next round of cell division. Approximately 15% of the gated cells have completed DNA replication and are preparing to enter the mitosis phase.
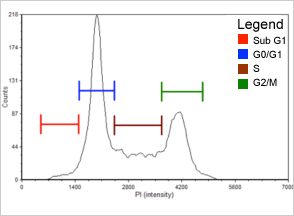
Figure 2. 0.06 µM Etoposide Population histogram for the etoposide (0.06 µM) treated Jurkat cells. There is a noticeable increase in the percent of cells that have arrested in the G2/M phase of the cell cycle (see Table 2). This can be seen in the increase in the G2/M peak (green gate) at ~ 4200 relative fluorescent units (RFUs).
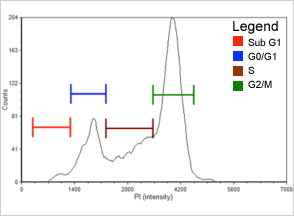
Figure 3. 0.12 µM Etoposide Population histogram for the etoposide (0.12 µM) treated Jurkat cells. At this drug concentration, most of the cells have now arrested at the G2/M phase. On the histogram, this can be seen as shift in the cell population from G0/G1 (blue gate) to G2/M (green gate) when compared to control and 0.06 µM etoposide samples.
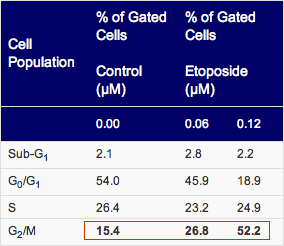
Table 2 shows the population distribution for control and etoposide treated cells. The treatment of Jurkat cells with etoposide arrested the cells in the G2/M phase of the cell cycle. As the etoposide concentration increased, the percent of cells that arrested in the G2/M phase of the cell cycle also increased from 15.4% to 52.2%.
The Cellometer fluorescence-based cell cycle analysis can be effectively implemented in studies examining the efficacy of cell cycle arresting drugs.
Leave A Comment