| Purpose | To demonstrate the capability of the Celigo to perform rapid, high throughput imaging and analysis of hematopoietic progenitor cell (HPC) proliferation using Ki-67 cellular marker. The Ki-67 protein is a biomarker for cell proliferation which are present in all the active phases of cell cycle such as G1, S, G2, and mitosis, but not in G0 phase. |
| Existing Method(s) | Flow cytometry, but is tedious to setup multiple samples, not idea for high-throughput assays |
| Target Cell Type | HPCs derived from iPSCs (one healthy and one diseased patient) |
| Experiment Plan | Cells were cultured in 6-well plates, samples from diseased and healthy donors, fixed, permeabilized, and stained for Ki-67 expression, and counterstained with DAPI. |
| Hypothesis | Celigo will be able to perform rapid, whole-well imaging and analysis of Ki-67 expression levels to compare between groups. |
Celigo Setup
| Plate Type | 6-well Corning |
| Scan Channels | Bright field, Green (DyLight488), Blue (DAPI) |
| Resolution | 1 µm/pixel |
| Scan Area | Whole well |
| Analysis Method | Target 1 + 2 + Mask |
| Scan Frequency | Once (endpoint) |
| Scan Time | 10 minutes |
Assay Protocol and Plate Setup
Goal:
To demonstrate the capability of the Celigo to perform rapid, high throughput imaging and analysis of cell proliferation using Ki-67 cellular marker.
Protocol:
Cell and stain preparation
- Collected different samples of iPSCs that were isolated from either healthy and diseased donors
- HPCs were plated into 6-well plates and incubated for 2 days (See plate map below)

- At end of incubation, cells were fixed with 4% formaldehyde, permeabilized with 0.2% Triton X-100
- The cells were then stained with primary rabbit anti-human Ki-67 overnight
- After overnight staining, the cells were washed and stained with secondary DyLight488 goat anti-rabbit IgG antibody for 1 hour
- Finally, they were washed and counterstained with DAPI for 30 min in the dark
- The stained cells were imaged and analyzed on Celigo for endpoint reading
Data Collection
- Immediately after, the plate was scanned in Celigo using Target 1 (BF) + 2 (Green) + Mask (Blue) for an endpoint scan
- Fluorescent gating was set up based on the DAPI mask to determine mean fluorescent intensity and % of Ki-67 positive cells
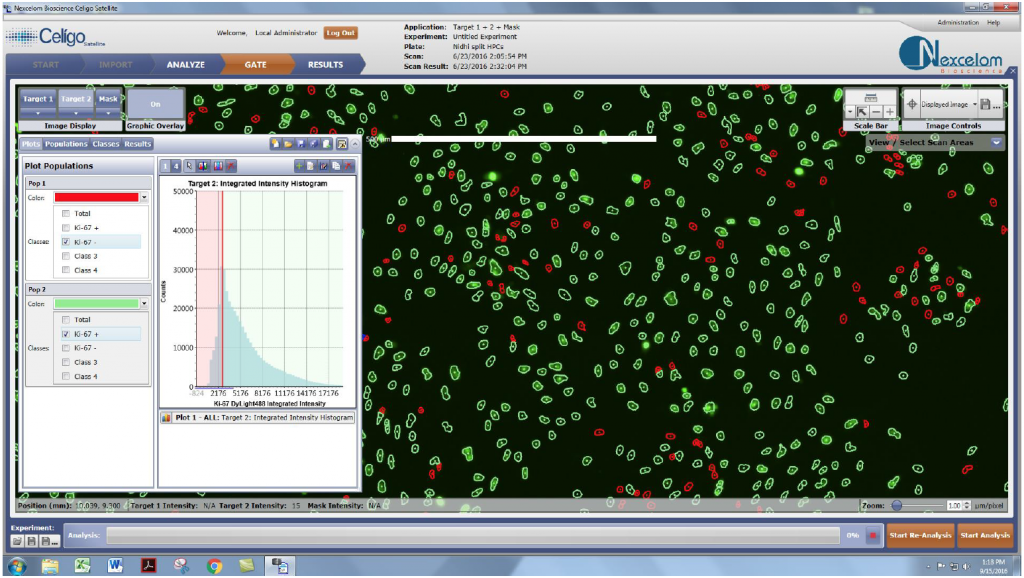
Data Analysis
- The images for each HPC sample were analyzed by using the DAPI-positive cells as the mask
- Next, the DyLight488 fluorescent intensities within the identified DAPI-positive cells were plotted under the Gate tab to determine the DyLight488-positive cell population percentages
Results
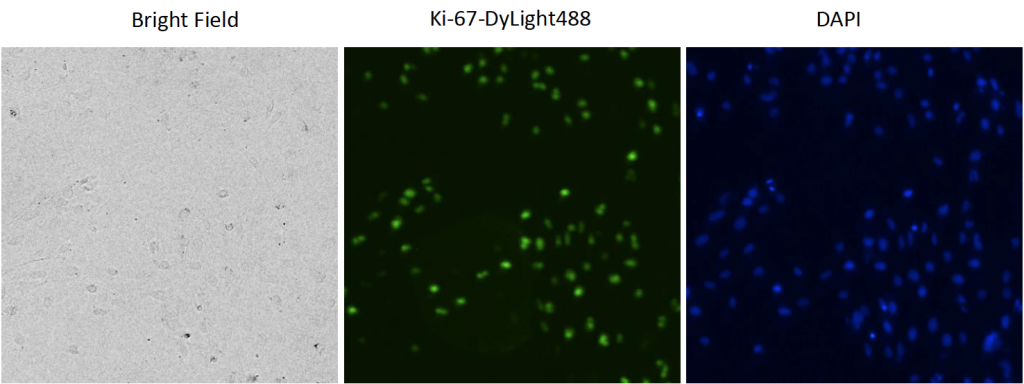
1. Celigo-captured bright field, DyLight288 and DAPI fluorescent images
- Examples of bright field, Ki-67-DyLight488 and DAPI-stained fluorescent images

- Celigo was able to count DAPI-positive cells, to determine the total population, use the gating function to identify Ki-67-positive cells and calculate the percent of Ki-67-positive cells for the whole plate

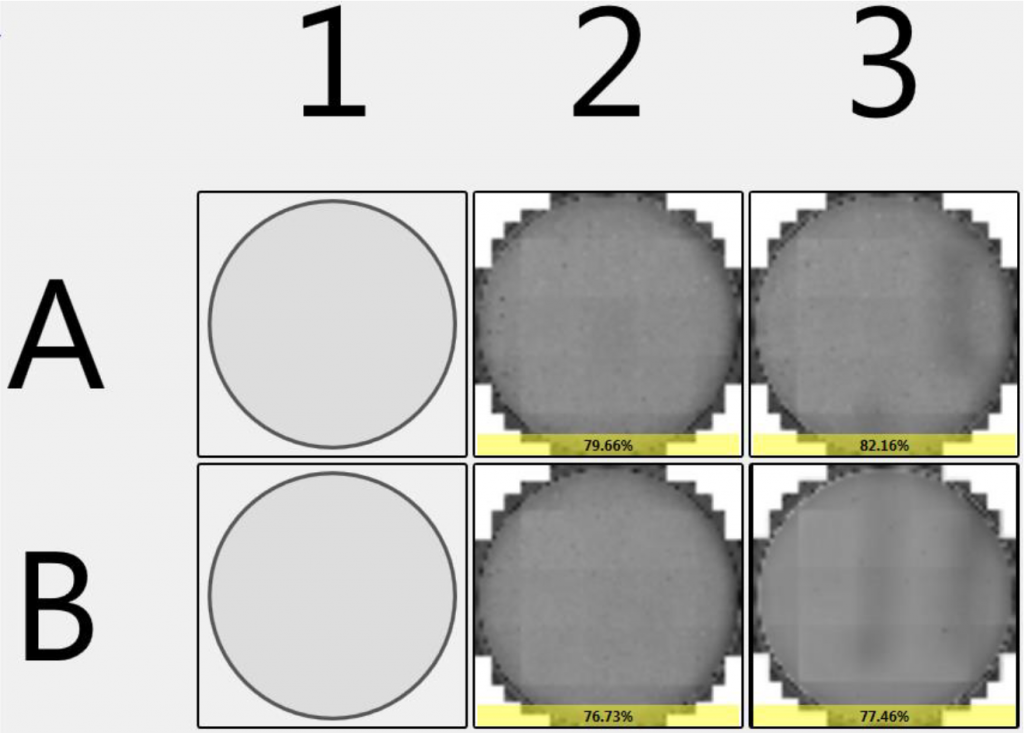
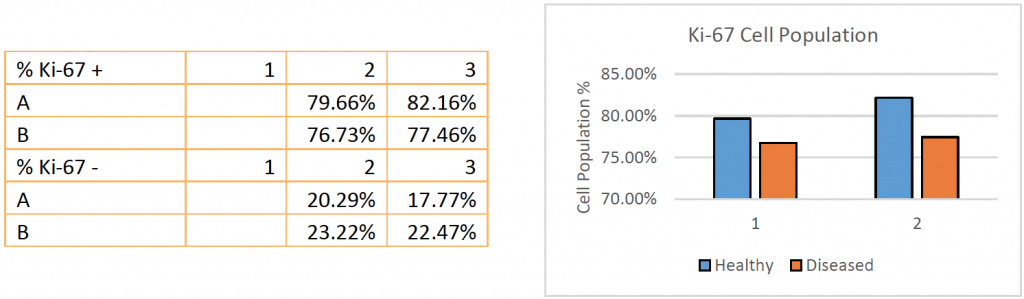
- Celigo was able to calculate the percent of Ki-67-positive cells for the individual wells of the entire plate

- Celigo was able to generate reports in table format

Conclusion
- Celigo was able to image and identify Ki-67-positive cell population percentages with the Celigo gating function
- The percent of Ki-67-positive cell population was automatically generated by Celigo software
- In this experiment, the cell proliferation for diseased patient samples was not significantly lower than the healthy patients shown in the Ki-67 cell population percentages above
- Celigo image cytometer allowed rapid bright field and fluorescent imaging of HPCs labeled with DyLight488 and DAPI