| Purpose | Measure NK cell-mediated cytotoxicity using calcein AM-stained K562 and IMR32 cells |
| Existing Method(s) | Calcein Release Assay, Flow Cytometry |
| Target Cell Type | Target: K562, IMR32; Effector: NK cells |
| Experiment Plan | Scan plate using Bright Field and Green Fluorescent channels |
| Hypothesis | By measuring the changes in the number of calcein AM-positive cells over time, the % cytotoxicity can be calculated using time 0 and control for normalization |
Celigo Setup
| Plate Type | Greiner 655090 96-well black wall clear bottom |
| Scan Channels | Bright field and Green |
| Resolution | 1 µm/pixel |
| Scan Area | Whole well |
| Analysis Method | Target 1 + 2 |
| Scan Frequency | Hourly, up to 4 hours |
| Scan Time | ~6 min |
Assay Protocol and Plate Setup
Goal:
Measure NK cell-mediated cytotoxicity using calcein AM-stained K562 and IMR32 for a duration of 4 hours.
Protocol:
Cell preparation
- K562 and IMR32 were obtained from ATCC and cultured in RPMI 1640 media
- Donor NK cells were obtained from buffy coat of PBMCs and expanded by co-culturing with irradiated (100Gy) K562 Clone9.mbIL21 and supplemented with 50 IU/ml IL2
- The K562 and IMR32 Target cells were stained with 10 µM of calcein AM (Nexcelom, Cat# CS1-0119) for 30 min and then washed 3 times with RPMI media
- The cells were then seeded into a 96-well plate at 10,000 cells/well
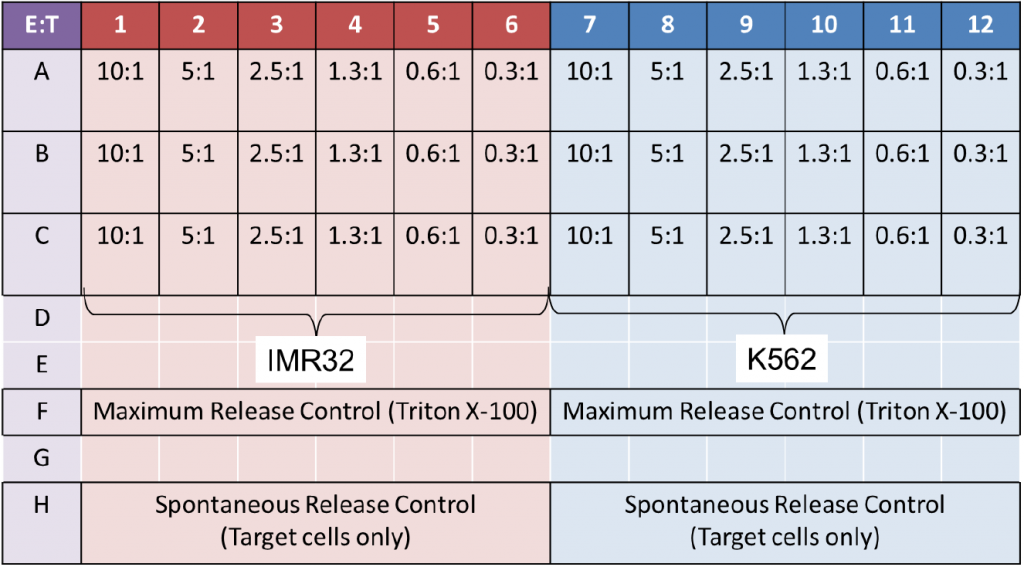
- Next, the Effector NK cells were added following the E:T ratios on the plate map below
- The spontaneous release samples were stained Target cells without Effector cells
- The maximum release samples were stained Target cells with Triton X-100
Data Collection
- After adding the Target and Effector cells, the plate was centrifuged to settle the cells to the bottom
- Immediately after, the plate was scanned in Celigo using Target 1 (Green) + 2 (BF) for t = 0 h
- Repeated the scanning for t = 1, 2, 3, and 4 h
Data Analysis
- The images for each time point were analyzed to count the total number of calcein AM-positive cells in each well
- The segmentation parameters in Analyze were setup using the calcein AM fluorescent images acquired at the last time point (t = 4 h)
- The parameters were applied to the other time points for counting calcein AM-positive cells
- Made sure only the bright calcein AM-positive cells were counted
- The parameters were set up to not count pieces of bright debris
- The parameters were set up to not count dim cells
Data Calculation
- The calcein AM-positive Target cells co-cultured with Effector cells were counted and recorded
- The calcein AM-positive Target cells only were counted and recorded

- The % cytotoxicity was calculated for every well and averaged to generate E:T ratio-dependent response and time-course monitoring
Results
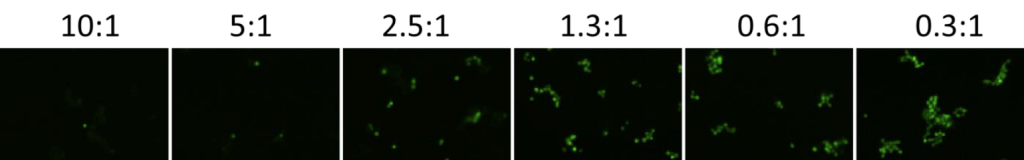
1. Celigo-captured calcein AM fluorescent images at different E:T ratios for IMR32
- Below are example calcein AM images for IMR32 at different E:T ratios
- The number of calcein AM-positive cells increased as the E:T ratios decreased
- The bar graph shows the % cytotoxicity at different E:T ratios and different time points for IMR32
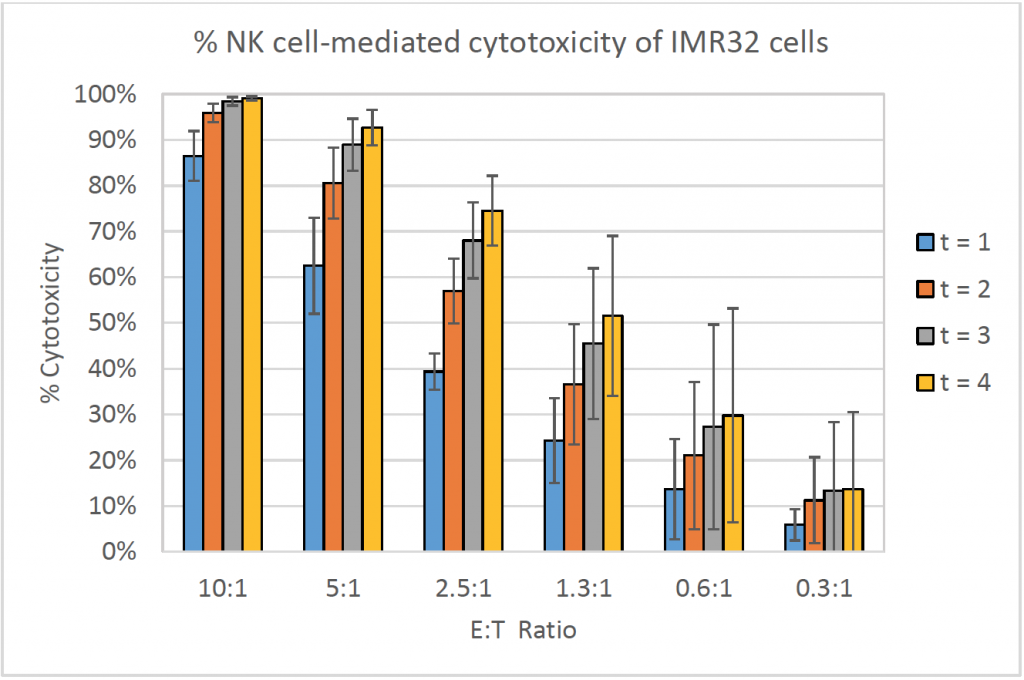
- The % cytotoxicity increased as the E:T ratios increased
- Similarly, the % cytotoxicity increased as the time increased
- The line graph shows the % cytotoxicity at different E:T ratios in respect to incubation time
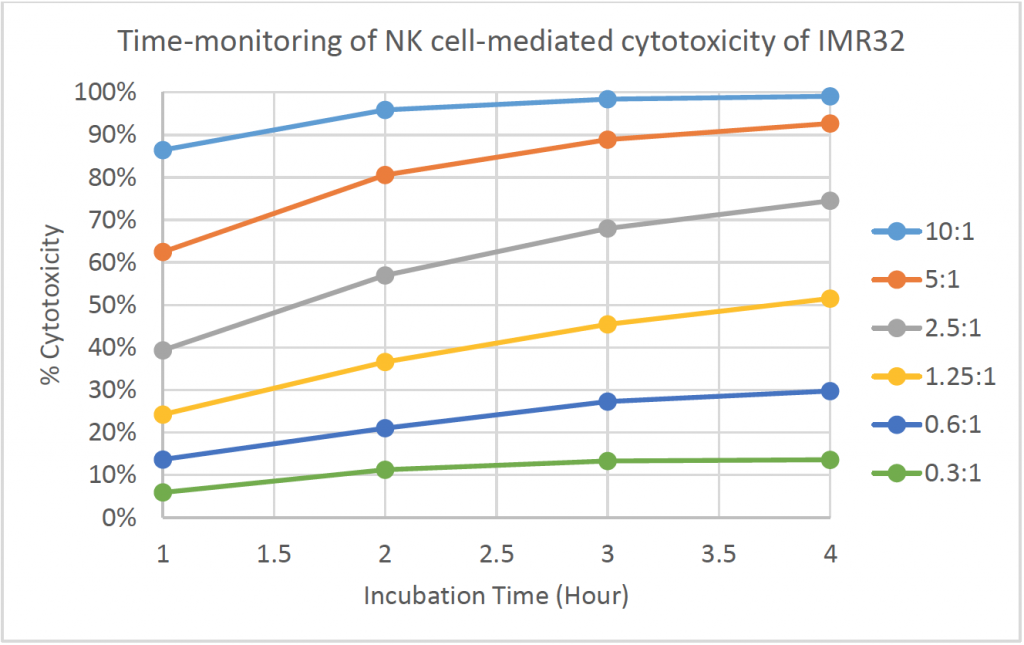
- The % cytotoxicity increased as the time increased for each E:T ratio
- At higher E:T ratios, the % cytotoxicity already reached ~90% at t = 1 h
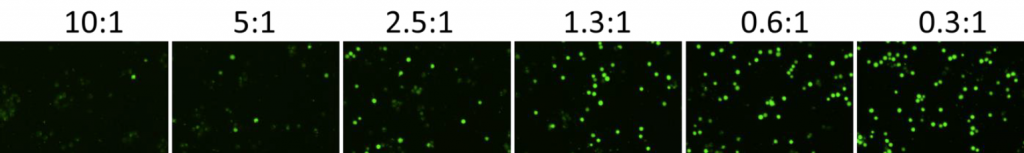
2. Celigo-captured calcein AM fluorescent images at different E:T ratios for K562
- Below are example calcein AM images for K562 at different E:T ratios
- The number of calcein AM-positive cells also decreased as the E:T ratios increased
- The bar graph shows the % cytotoxicity at different E:T ratios and different time points for K562
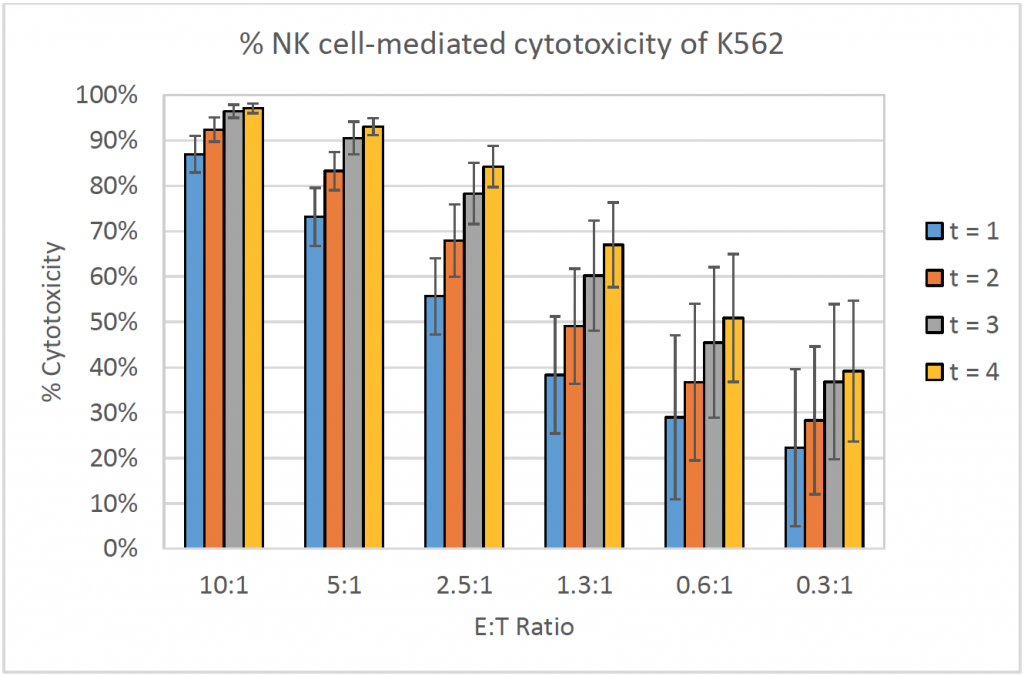
- The % cytotoxicity increased as the E:T ratios increased
- Similarly, the % cytotoxicity increased as the time increased
- The line graph shows the % cytotoxicity at different E:T ratios in respect to incubation time
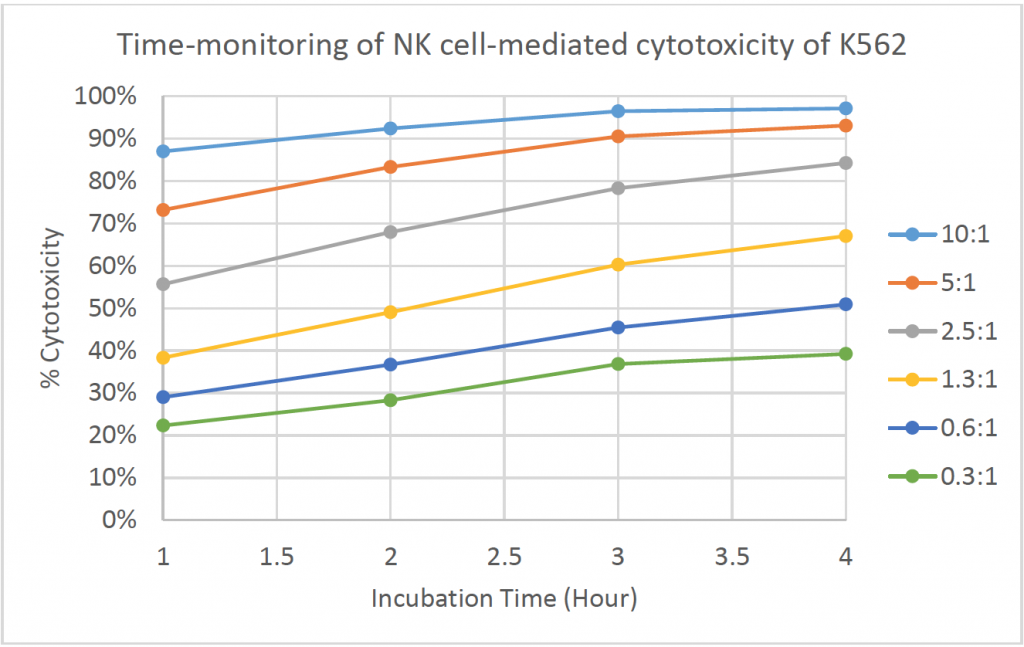
- The % cytotoxicity increased as the time increased for each E:T ratio
- At higher E:T ratios, the % cytotoxicity already reached ~90% at t = 1 h
Conclusion
- Time-course tracking of NK cell-mediated cytotoxicity can eliminate the need of maximum release control (Triton X-100) used in release assays, as well as normalizing to non-uniform seeding at t = 0 h
- The Celigo was able to count both suspension (K562) and adherent (IMR32) live cells
- The number of cells used is significantly less than the cells needed for release assays and flow cytometry assays, which can save time, money and precious primary immune cells
- Flow cytometry assays and release assays usually require a seeding density of 100,000 Target cells, which translate to 1 million Effector cells at E:T ratio of 10:1
- Celigo requires less than 10,000 Target cells, which translate to less than 100,000 Effector cells at E:T ratio of 10:1
- The decrease in the number of live calcein AM-positive Target cells in the fluorescent images was successfully measured to show the effect of NK cell-mediated cytotoxicity