| Purpose | Measure PBMC-mediated cytotoxicity by counting total live K562 cells over time in the presence and absence of IL2 |
| Existing Method(s) | Chromium Release Assay, Flow Cytometry |
| Target Cell Type | Target: K562 ; Effector: PBMCs |
| Experiment Plan | Scan plate using Bright field and Green Fluorescent channel |
| Hypothesis | By measuring the changes in the number of calcein AM-positive cells over time, the % cytotoxicity can be calculated using time 0 and control for normalization |
Celigo Setup
| Plate Type | Greiner 655090 96-well black wall clear bottom |
| Scan Channels | Bright field and Green |
| Resolution | 1 µm/pixel |
| Scan Area | Whole well |
| Analysis Method | Target 1 + 2 |
| Scan Frequency | Hourly, up to 4 hours |
| Scan Time | ~7 min |
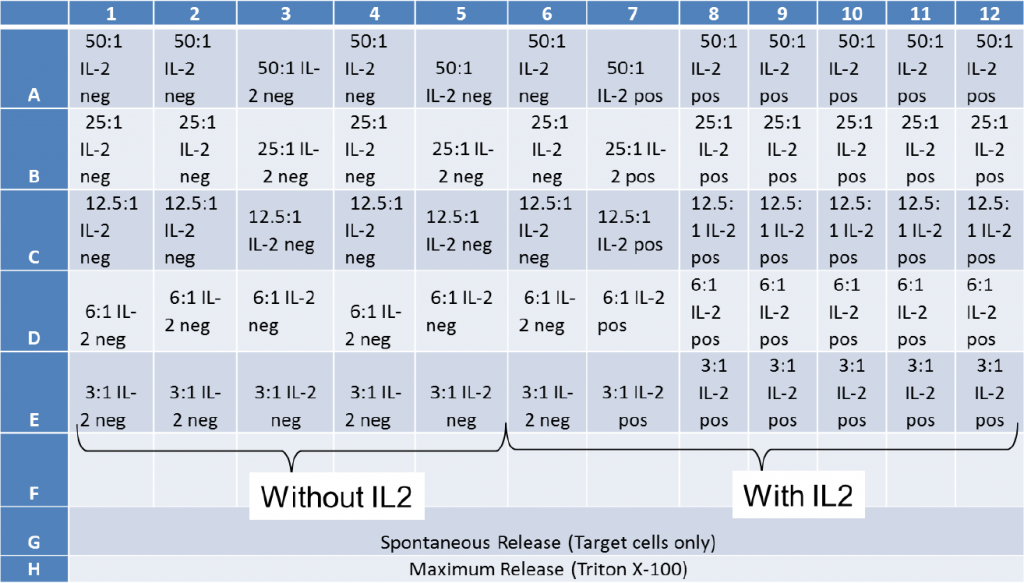
Assay Protocol and Plate Setup
Goal:
Measure PBMC-mediated cytotoxicity using calcein AM-stained K562 Target cells for a duration of 4 hours.
Protocol:
Cell Preparation
- K562 cells were obtained from ATCC and cultured in RPMI 1640 media
- Two donors were obtained from buffy coat using Ficoll process
- The K562 Target cells were stained with 5 µM of calcein AM (Nexcelom, Cat# CS1-0119) for 30 min and then washed 3 times with RPMI media
- The cell were then seeded into a 96-well plate at 10,000 cells/well
- Next, the PBMCs were added, following the E:T ratios on the plate map below
- Finally, IL2 was added to half of the wells to activate NK cells
a. The spontaneous release samples were stained Target cells without Effector cells
b. The maximum release samples were stained Target cells with Triton X-100
Data Collection
- After adding the Target and Effector cells and IL2, the plate was centrifuged to settle the cells to the bottom
- Immediately after, the plate was scanned in Celigo using Target 1 (Green) + 2 (BF) for t = 0 h
- Repeated the scanning for t = 1, 2, 3, and 4 h
Data Analysis
- The images for each time point were analyzed to count total number of calcein AM-positive cells in each well
- The segmentation parameters in Analyze were setup using the calcein AM fluorescent images acquired at the last time point (t = 4 h)
- The parameters were applied to the other time points for counting calcein AM-positive cells
- Made sure only the bright calcein AM-positive cells were counted
- The parameters were setup to not count pieces of bright debris
- The parameters were setup to not count dim cells
Data Calculation
- The calcein AM-positive Target cells co-cultured with Effector cells were counted and recorded
- The calcein AM-positive Target cells only were counted and recorded
- Normalized to t = 0
- Normalized to spontaneous release
- o % 𝐶𝑦𝑡𝑜𝑡𝑜𝑥𝑖𝑐𝑖𝑡𝑦 = % 𝑐𝑦𝑡𝑜𝑡𝑜𝑥𝑖𝑐𝑖𝑡𝑦 (𝑠𝑎𝑚𝑝𝑙𝑒) − % 𝑐𝑦𝑡𝑜𝑡𝑜𝑥𝑖𝑐𝑖𝑡𝑦 (𝑠𝑝𝑜𝑛𝑡)
- The % cytotoxicity was calculated for every well and averaged to generate E:T ratio-dependent response and time-course monitoring
Results
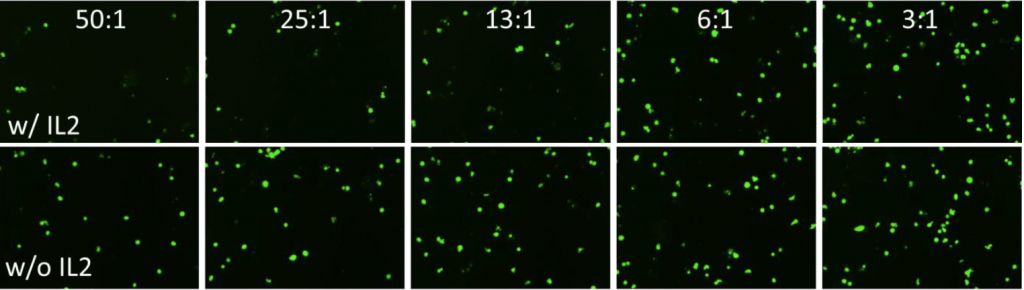
1. Celigo-captured calcein AM fluorescent images at different E:T ratios for K562
- Below are example calcein AM images for K562 at different E:T ratios
- The number of calcein AM-positive cells increased as the E:T ratios decreased
- Samples in the presence of IL2 showed higher cell killing compared to samples in absence of IL2
- The bar graph shows the % cytotoxicity at different E:T ratios for different donors at t = 4 h
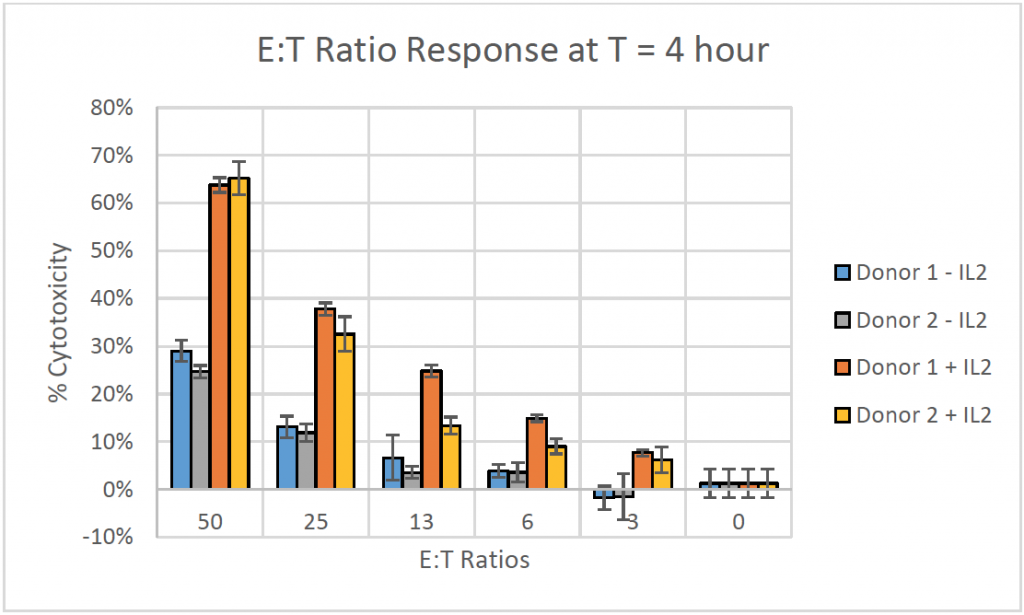
- The % cytotoxicity increased as the E:T ratios increased
- Samples in presence of IL2 showed greater than double the cytotoxicity in comparison to samples in absence of IL2
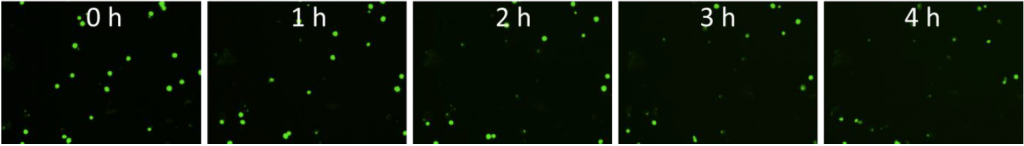
2. Celigo-captured calcein AM fluorescent images at different time points for K562
- Below are example calcein AM images for K562 at different time points at E:T ratio of 50:1
- The number of calcein AM-positive cells also decreased as the time increased
- The line graph shows the % cytotoxicity in respect to incubation time
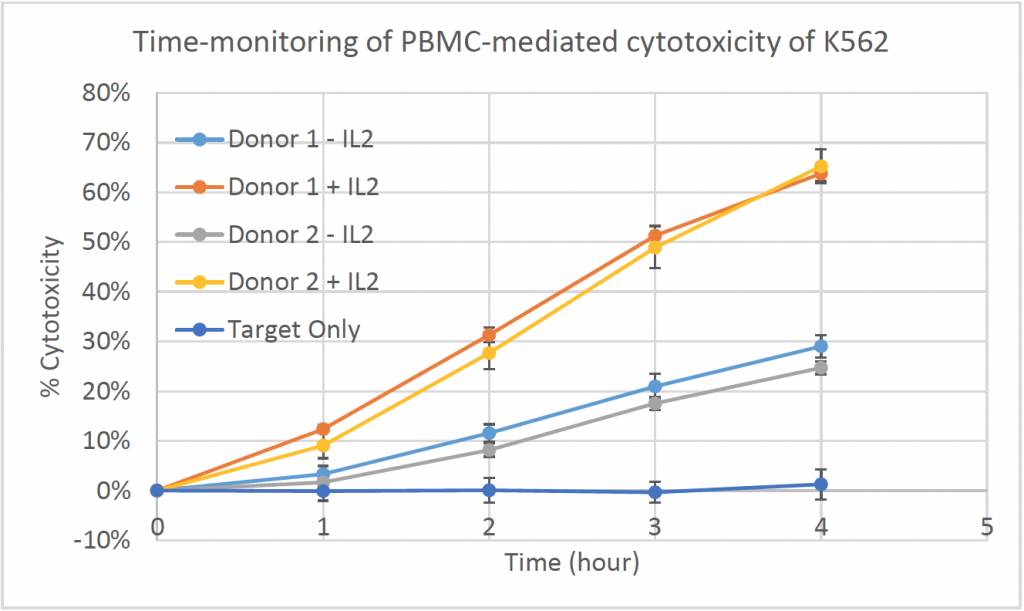
- The % cytotoxicity increased as the time increased for each donor at E:T ratio of 50:1
- Donor PBMCs with activation using IL2 showed % cytotoxicity as high as 65%
Conclusion
- Time-course tracking of PBMC-mediated cytotoxicity can eliminate the need of maximum release control (Triton X-100) used in release assays, as well as normalizing to non-uniform seeding at t = 0 h
- The number of cells used is significantly less than the cells needed for release assays and flow cytometry assays, which can save time, money and precious primary immune cells
- Flow cytometry assays and release assays usually require a seeding density of 100,000 Target cells, which translate to 1 million Effector cells at E:T ratio of 10:1
- Celigo requires less than 10,000 Target cells, which translate to less than 100,000 Effector cells at E:T ratio of 10:1
- The decrease in number of live calcein AM-positive Target cells in the fluorescent images was successfully measured to show the effect of PBMC-mediated cytotoxicity