Video: 3D Tumor Spheroid-Based Functional Assays – Invasion into Matrigel
Welcome to the Celigo image cytometer video demo series. Today we will be discussing 3D tumor spheroid-based functional assays, specifically the invasion into Matrigel.
The Celigo Cytometer has been used to perform multiple 3D tumor spheroid-based functional assays. This video, describes a 3-dimentinal invasion into Matrigel as a model for tumor invasion.
Let me show you how this experiment was conducted.
Experimental Design
Glioblastoma U-87 MG cells were seeded at 1000 cells per well in a U-bottom 96-well Ultra-low attachment plate. Spheroids form over the next 4 days.
On day 4, U-87 MG spheroids were embedded into Matrigel with serially diluted 17-AAG drug treatment or DMSO vehicle control. Six replicates were prepared for each condition. The plate is now ready to be imaged.
Automated image acquisition and quantification was carried throughout the entire experiment. Imaging was done before and right after Matrigel embedding — which is considered time-point –zero of the experiment, and then again at 24 hrs, 48 hrs, and 72 hrs after the start of drug treatment.
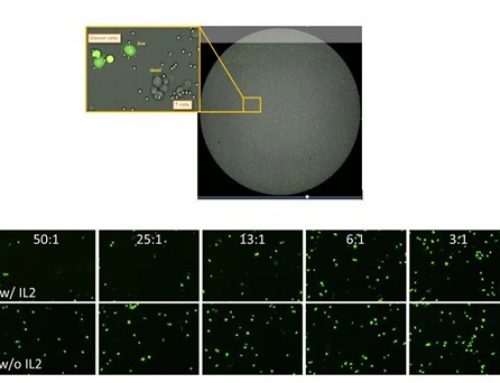
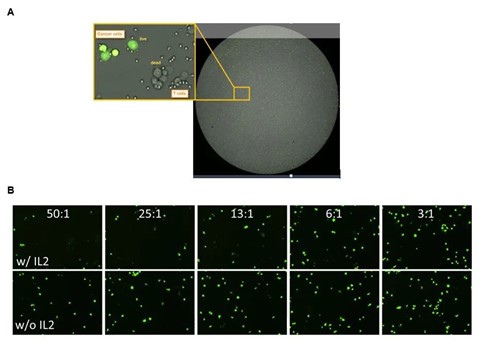
Here we can see how a typical scan result after image analysis looks like. The entire plate is shown with thumb-nail pictures of each imaged well.
Control Spheroid at t=0 h and t=48 h
This plate represents time-zero of the drug treatment. Lets look at the vehicle control well D10.
The blue outline indicates the area occupied by the spheroid identified by the Celigo software.
The green fill color is another visual representation of the counted spheroids. Next let us look at the same spheroid 48 hours later. The area occupied by invading the cells is much larger compared to time zero.
t=48 h Control and Drug Treated Spheroid
In other wells on this plate, the spheroids were treated with different concentrations of 17-AAG. Navigate between any well on the plate to quickly examine differences between experimental conditions. In this well, we see that the invasion into Matrigel is inhibited by 2.5 µM drug treatment. As you can see we can go across the drug treatment concentrations to look at different wells at different conditions and get a quick global view and understanding of the conducted experiment and then compare it to the control.
Export Data to Excel
By exporting the data to excel we can look the results acquired for the entire plate. Using the confluence application, the software calculates the percent of the area covered by the spheroid to the total scanned area. Invasion was normalized to time zero. Graphs and tables can be easily created to reflect the data gathered from the experiment. When we compare the area covered by the control spheroid or by the drug treated spheroid, we observe that the invasion of U-87 MG cells is inhibited by 17-AAG in a dose-depended manner.
Other 3D Assays
Other 3D functional assays that have been performed on the Celigo include:
Migration on extracellular matrix
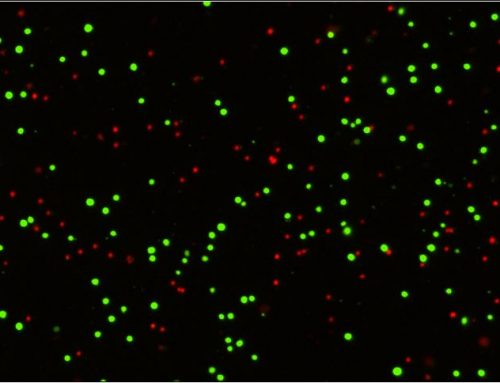
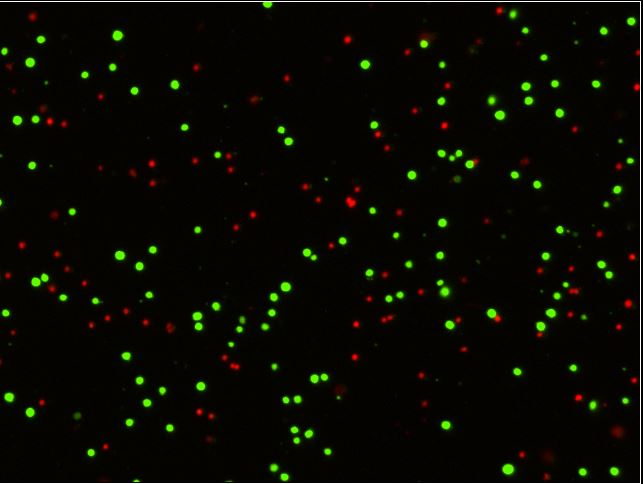
Tumor spheroid viability (Calcein AM/PI)
Tumor spheroid / Embryoid body Confrontation Culture
Reference: Vinci et al. BMC Biology 2012, 10:29
Leave A Comment