Transcript
Hi, I am Dr. Leo Chan from Nexcelom Bioscience, today I am presenting a label-free direct cell counting method to normalize your Seahorse™ XF data, using image cytometry.
One of the critical factors to ensure accurate Seahorse™ analysis results is uniform cell seeding density. What happens if seeding is not uniform?
Currently, researchers normalize Seahorse™ results using protein analysis assay such as BCA to minimize the effects of non-uniform cell seeding.
The assay requires preparation of protein standards as well as BCA working reagents. Next, the test samples are mixed with the working reagent and then incubated for 30 min at 37°C. Finally, the mixture is cooled and the protein contents are analyzed using a spectrophotometer.
Protein analysis is a widely used method due to its availability in biological laboratories, however, it is time-consuming, taking usually 45 min to complete. The assay requires multiple steps of washing, lysing, and sample transfer. This can risk sample loss during protocol that may cause variation in final results.
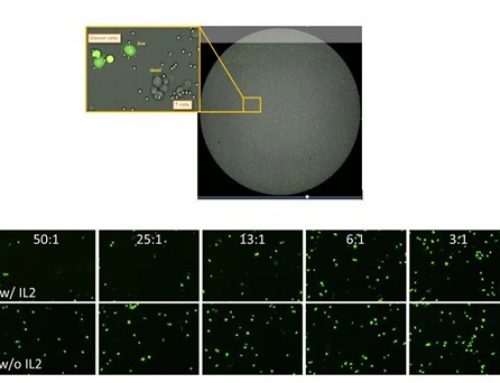
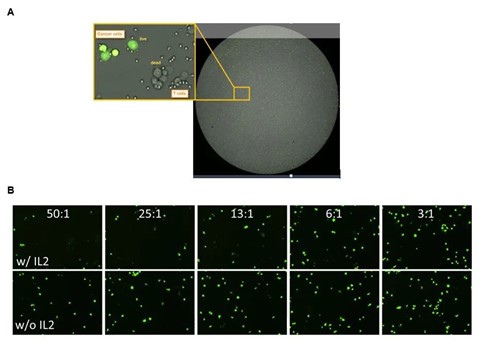
In contrast, the image cytometry method images and analyzes acquired images directly from the wells for QC cell seeding density as well as normalization. High resolution whole well bright field images of the Seahorse™ XF96 plate are captured. The cells in the wells are then identified and accurately counted by excluding the area of the 3 posts.
This method only takes 4 seconds per whole-well, 5 minutes per plate for scanning and counting. It can directly count cells without fluorescent labeling for both adherent and suspension cells. Finally, it improves cell count accuracy by excluding the 3 posts area.
To perform Seahorse™ data normalization with label-free cell counting,
Methods:
- First, seed your cells (DCIS and HCT116) in the wells, and allow the cells to adhere overnight
- Next, Wash the cells and count using Celigo prior to Seahorse™ analysis
- Subsequently, perform Seahorse™ analysis to measure OCR and ECAR
- And finally, normalize the Seahorse™ readout using the direct cell counting results
After capturing the whole well bright field images, the cells are identified in the whole well with the 3 posts excluded. The Celigo then automatically generated total cell count per well showing in the results page that can be exported directly to Excel for normalization process.
The Seahorse™ data were normalized using total protein amount and cell counts. The measured glycolytic function showed no distinction in ECAR values between the two cell lines. However, the cell count normalization method showed a clear separation between the two cell lines, as well as a significant reduction in standard deviation.
In comparison to BCA Protein Normalization Method, the Celigo Cell Count Normalization Method only requires 5 min per plate. It can directly count cells in whole well without labels for both adherent and suspension cells. Finally, it can improve cell count accuracy by excluding post area.
For more information on performing cell count-based normalization for Seahorse™ XF using image cytometry, please contact us at Nexcelom.com
Leave A Comment