Quantitative Measurement of GFP Transfection
Introduction to GFP
Green Fluorescent Protein (GFP) is a 26.9 kDa protein first identified in crystal jellyfish, Aequorea victoria. It was discovered that when exposed to blue or ultraviolet light the protein fluoresces green. After GFP was first expressed in E. coli in 1994 it was soon confirmed that GFP can also be successfully expressed in other organisms as well. Since then, not only have many fluorescent proteins of different colors been generated, but their function is enhanced to provide a faster and stronger fluorescent signal.
GFP Applications
- GFP is often used as a reporter of gene or protein expression. By detecting GFP expression it is possible to quantify the transfection/transduction efficiency.
- By staining the cells with propidium iodide we can monitor the viability of the culture during GFP expression.
- In cultures that are co-transduced with GFP and RFP, the Cellometer has the capability to capture, analyze, and report the population of GFP positive, RFP positive, or dual positive.
Acquiring GFP Expression Efficiency
With the Cellometer Vision CBA, just 20 µl of sample is added to the Cellometer Counting Chamber. Imaging and analysis of GFP expression is completed in less than 60 seconds. Bright field and fluorescent cell images can be viewed to check cell morphology and verify cell counting. Total cell count, concentration, and mean diameter are automatically displayed.
Quantifying GFP Efficiency in 4 Easy Steps
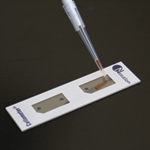
1. Pipette 20 µl of sample into a disposable slide.
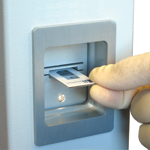
2. Insert slide into the instrument
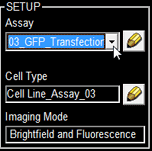
3. Select assay from a drop down menu
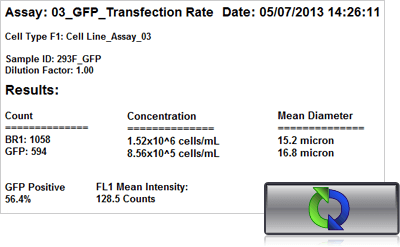
4. Click count, acquire image and view cell count, concentration, diameter and percent of GFP positive cells
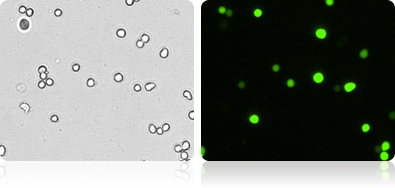
GFP Expression in 293T Cells
Automatically measure the number and percent of GFP positive cells in the population.
Bright Field and Fluorescent 293T Cell Images
| Count | Concentration | Mean Diameter |
|---|---|---|
| BR1: 1058 | 1.52×10^6 cells/mL | 15.2 micron |
| GFP: 594 | 8.56×10^5 cells/mL | 16.8 micron |
| GFP Positive 56.4% | ||
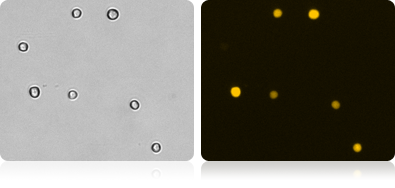
RFP Expression in RWPE-1 Cells
Automatically measure the number and percent of RFP positive cells in the population.
Bright Field and Fluorescent RWPE-1 Cell Images
| Count | Concentration | Mean Diameter |
|---|---|---|
| BR1: 1216 | 1.77×10^6 cells/mL | 19.6 micron |
| RFP: 596 | 8.70×10^5 cells/mL | 21.2 micron |
| RFP Positive 49.2% | ||
GFP Expression and Propidium Iodide Viability in Mouse Embryonic Stem Cells
Monitor cell health by adding PI to the GFP expression assay. The number and percent of the dead, PI positive cells, are shown along with the GFP expression readout.
Bright Field and Fluorescent Cell Images of Mouse Embryonic Stem Cells

| Count | Concentration | Mean Diameter | Ratios |
|---|---|---|---|
| GFP: 452 cells | 1.29×10^6 cells/mL | 12.2 microns | GFP Positive: 17.7% PI Positive: 46.7% Dual Positive: 0.1% |
| PI: 1203 cells | 3.39×10^6 cells/mL | 9.4 microns | |
| BR Total Cell: 2570 cells | 7.26×10^6 cells/mL | 10.0 microns |
Co-Expression of GFP/RFP in T-cells
Image and Analyze double positive GFP/RPF cell populations. The Cellometer automatically reports each population as well as number and percent of dual positive cells.
Bright Field and Fluorescent T-Cell Images

| Count | Concentration | Mean Diameter | Ratios |
|---|---|---|---|
| GFP: 368 cells | 5.20×10^5 cells/mL | 10.3 microns | GFP Positive: 38.4% RFP Positive: 69.5% Dual Positive: 38.2% |
| RFP: 667 cells | 9.42×10^5 cells/mL | 10.1 microns | |
| BR Total Cell: 962 cells | 1.36×10^6 cells/mL | 9.0 microns |
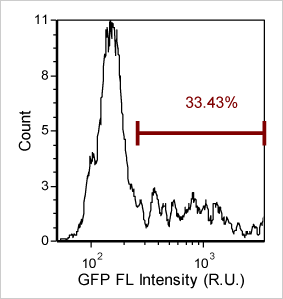
Detecting Cells Expressing Weak GFP Signal
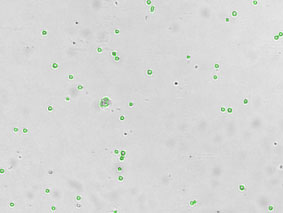
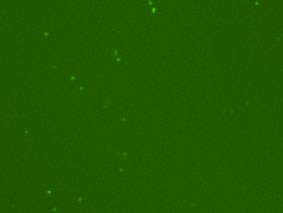
Export and analyze Cellometer captured data in flow cytometry software FCS Express. By plotting the mean fluorescent intensity of the GFP signal we can determine the percent of GFP positive cells in the primary bone marrow sample.
Quantify GFP expression using FCS Express Software
Bright Field Counted Image
Fluorescence Image
Other Fluorescent Proteins
For Cellometer Vision CBA, customizable fluorescent optics modules are available for specific fluorescent proteins.
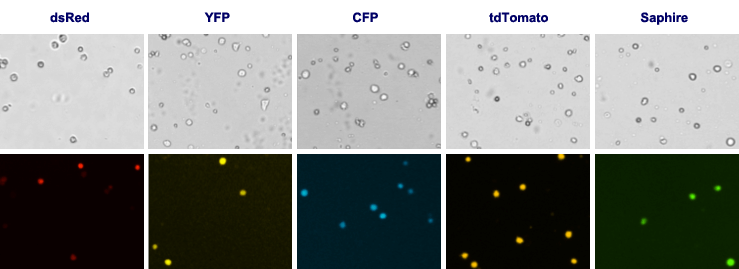
Fluorescent Optics Modules for the Detection of Fluorescent Proteins
| Optics Module | Fluorophores | Nucleic Acid Stains | Fluorescent Proteins |
|---|---|---|---|
| VB-450-302 Ex: 375 nm Em: 450 nm |
AlexaFluor® 350 | DAPI Hoechst 33342 Hoechst 33258 |
BFP CFP |
| VB-535-402 Ex: 475 nm Em: 535 nm |
Calcein FITC AlexaFluor® 488 |
AO (acridine orange, +DNA) SYTO®9, SYTO®13 |
GFP YFP |
| VB-595-502 Ex: 525 nm Em: 595 nm |
AlexaFluor® 546 AlexaFluor® 555, Cy3® PE (R-phycoerythrin) Rhodamine B |
PI (propidium iodide) EB (ethidium bromide) SYTOX® Orange |
57.5 RFP |
| VB-660-503 Ex: 540 nm Em: 660 nm |
AlexaFluor® 647 7-AAD Nile Red |
PI (propidium iodide) EB (ethidium bromide) AO (acridine orange, +RNA) |
Ds Red TdTomato |
| VB-695-602 Ex: 630 nm Em: 695 nm |
AlexaFluor® 647, Cy5® APC (allophycocyanin) |
SYTOX® Red | Crimson |
*This table is a partial list of compatible fluorophores, nucleic acid stains, and fluorescent proteins. Please contact Nexcelom technical support regarding compatibility of other reagents.
Sytox, AlexaFluor, and Cy are trademarks of Life Technologies
GFP Expression in Various Mammalian Cells
Shown here are several examples of GFP expressing cell lines. A bright field and a GFP image was collected for each cell type.
Bright Field and Fluorescent COS-7 Cell Images
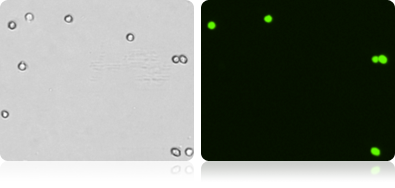
Bright Field and Fluorescent COS-7 Cell Images

Bright Field and Fluorescent HeLa Cell Images
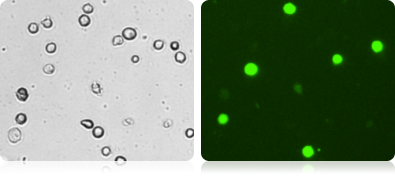
Bright Field and Fluorescent HeLa Cell Images

Bright Field and Fluorescent H1299 Cell Images
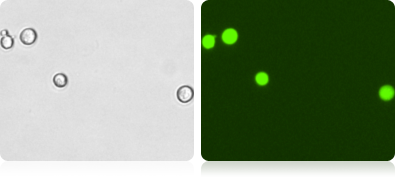
Bright Field and Fluorescent H1299 Cell Images

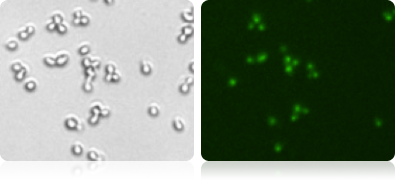
GFP Expression in Yeast (measured by Vision 10X)
Conclusion & Cellometer Selection
Cellometer image cytometry may be effectively utilized to determine GFP or other fluorescent protein transduction/transfection efficiency. Furthermore, it may be used to study not only GFP-expressing mammalian cell lines, but also GFP-expressing yeast cells. This robust instrument platform along with separate software-solutions provides researchers with the ability to detect strong and weak fluorescent signals.
Please contact an application specialist to determine which Cellometer is right for you!
Publications Using Cellometer for GFP Detection
- Ho YK, Zhi HJ, DeBiaso D, Philip S, Shih HM, Giam CZ. (2012) HTLV-1 Tax-Induced Rapid Senescence Is Driven by the Transcriptional Activity of NF-kappa B and Depends on Chronically Activated IKK alpha and p65/RelA. Journal of Virology 86(17): 9474-9483
- Glazer ES, Zhu CH, Massey KL, Thompson CS, Kaluarachchi WD, Hamir AN, Curley SA. (2010) Noninvasive Radiofrequency Field Destruction of Pancreatic Adenocarcinoma Xenografts Treated with Targeted Gold Nanoparticles. Clinical Cancer Research 16(23): 5712-5721
- Chetram MA, Odero-Marah V, Hinton CV. (2011) Loss of PTEN Permits CXCR4-Mediated Tumorigenesis through ERK1/2 in Prostate Cancer Cells. Molecular Cancer Research 9(1): 90-102
- Miller D, Reynolds GE, Mejia R, Stark JM, Murnane JP. (2011) Subtelomeric regions in mammalian cells are deficient in DNA double-strand break repair. DNA Repair 10(5): 536-544
- Kainov DE, Muller KH, Theisen LL, Anastasina M, Kaloinen M, Muller CP. (2011) Differential Effects of NS1 Proteins of Human Pandemic H1N1/2009, Avian Highly Pathogenic H5N1, and Low Pathogenic H5N2 Influenza A Viruses on Cellular Pre-mRNA Polyadenylation and mRNA Translation. Journal of Biological Chemistry 286(9): 7239-7247
