Stem Cells
Introduction to Stem Cells
The use of primary stem cells has become common place in fields such as cancer therapy, regenerative medicine, transplantation and basic oncology research. Although they are widely used, the generated stem cells are a precious commodity in any lab. Because stem cells, whether mesenchymal, embryonic or iPSC, are typically used in downstream experiments examining surface marker expression, cell differentiation and determining therapeutic potential the initial seeding density, as well as cell sample size, plays an important role in the use of these cells.
The Cellometer line of automated cell counters incorporates image based cell counting and fluorescence detection in a compact and easy-to-use instrument that reliably automates cell counting, viability determination and other fluorescent assays. By simply pipetting 20µL of sample into a disposable chamber, Cellometer acquires cell images that are analyzed to determine cell counts, concentration, cell sizes, and fluorescence intensity, typically in 30 seconds or less, making them an ideal instrument for low volume samples. Similarly, 20 µL is needed to perform GFP trasduction/transfection efficiencies, cell cycle analysis or any other cell-based-assay.
This combination of features makes it ideal for use in stem cell research. Samples can be counted and viability determined with Trypan Blue using the bright field Cellometer cell counters. Our fluorescent Cellometer cell counters and image cytometer systems combine this bright field functionality with fluorescent detection to also determine stem cell viability using fluorescent stains such as Propidium Iodide, and being able to accurately determine concentration of nucleated cells in human bone marrow or cord blood. The fluorescence imaging mode can also be used to quantify GFP transfection efficiency when transfecting stem cells.
Accurate Counting of Stem Cells
Cell images acquired in the brightfield mode are analyzed to determine total cell count. Concentration is automatically calculated, and all data is automatically saved or exported. This eliminates user to user variability and improves throughput over manual counting methods, especially when analyzing stem cells which can be clumpy or irregularly shaped.
Embryonic Stem Cells


Figure 1: Images of embryonic stem (ES) cells acquired by Cellometer. Green circles indicate cells that have been counted by the Cellometer software.
Irregular & Clustered Stem Cells


Figure 2: Cell clusters or irregular shaped cells can be accurately counted. Green circles indicate cells that have been counted by the Cellometer software.
Automated Determination of Stem Cell Viability
Stem cell viability can be determined by several methods. Dead cells stained with trypan blue can be analyzed in the brightfield mode (figure 3). Detecting viability via fluorescent dyes, such as propidium iodide (PI) can be performed by acquiring brightfield images for total cell concentration and fluorescent images to count PI stained dead cells.
Human Mesenchymal Stem Cells


Figure 3: Analyzed brightfield images of Human mesenchymal stem cells (HMSC) cells show live cells circled in green and trypan blue stained dead cells circled in red.
Mouse Embryonic Feeder Cells


Figure 4. Brightfield image of Mouse Embryonic Feeder (MEF) cells in the brightfield image, PI stained dead cells are visible in the fluorescence imaging mode.
Bone Marrow Stem Cells – CD34+

Figure 1: Images of embryonic stem (ES) cells acquired by Cellometer. Green circles indicate cells that have been counted by the Cellometer software.
Quantifying GFP Transfection Efficiency
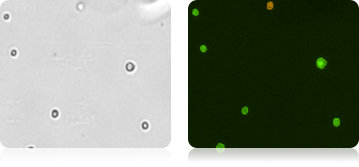
The unique bright field/fluorescent imaging capabilities can also be used to quantify transfection efficiency when using reporter proteins such as GFP, without having to use complex methods, such as flow cytometry. A total count is acquired in the bright field mode, and GFP positive cells are counted in fluorescent mode to calculate the percentage of cells that are expressing GFP.
Transfected Mouse Embryonic Feeder Cells


Figure 8: Mouse embryonic feeder (MEF) cells that have undergone transfection. Total cell count is determined in the bright field image (left), GFP positive cells are indicated by green circles in the fluorescent image (right).
Example Results of Stem Cells Analyzed on Cellometer
| Cell Type | Cell Concentration | Cell Detection/Viability |
|---|---|---|
| CD 34 + | 4.81 x 10⁶/ml | PI viability: 74.3% |
| Mouse embryonic feeder cell (MEF) | 5.18 x 10⁵/ml | AO or AO/PI |
| Mouse embryonic feeder cell (MEF) | 2.48 x 10⁶/ml | Trypan blue viability: 92.1% |
| Mouse embryonic feeder cell (MEF) | 1.06 x 10⁶/ml | PI viability: 91.0% |
| Transfected Mouse embryonic feeder cell (MEF) | Total: 3.52 x 10⁶/ml GFP: 8.24 x 10⁵/ml |
GFP |
| Human mesenchymal stem cells (HMSC) | 6.49 x 10⁶/ml | Trypan blue viability: 91.4% |
| Induced pluripotent stem cell (IPS) | 7.51 x 10⁵/ml | Trypan blue viability: 37.9% |
| Human cord blood | 1.40 x 10⁷/ml | AO or AO/PI |
| Human bone marrow | 7.32 x 10⁷/ml | AO or AO/PI |
| Adult cardiac stem cell | 3.30 x 10⁵/ml | Trypan blue viability: 85.3% |
| Human embryonic stem cell (HES) | 2.38 x 10⁶/ml | None |
| Transfected human embryonic stem cell (HES) | 1.23x 10⁶/ml RFP: 8.32×10⁵/ml |
RFP |
