Chimeric Antigen Receptor (CAR) T-Cell-Mediated Cytotoxicity
Measure Chimeric Antigen Receptor (CAR) T-Cell-Mediated Cytotoxicity
- Image and plot killing of target cells by CAR-T cells
- Produce data for measuring percent cytotoxicity
- Capture BF and FL images that demonstrate killing of target cells by CAR-T cells
Measure CAR T-Mediated Cytotoxicity using Tracer and Viability Dyes
Chimeric antigen receptor (CAR-T) therapy focuses on generating a genetically modified human t-cell that can directly bind to, and attack cancer cells. The CAR-T cell is comprised of a tumor-specific, antigen-binding domain that is fused to the genetically engineered activating motif. Once expressed on the cell surface the t-cell can target and attack cancer-specific cells.

By labeling the target tumor cells with non-toxic, non-radioactive calcein AM, we can monitor the killing of the tumor cells by CAR-T cells. While live target cancer cells will be labeled by a green calcein AM, the dead cells cannot retain the green dye and therefore will release it into the surrounding media. Alternatively, target tumor cells can be stained with membrane-bound CFSE dye at the start of the experiment and counterstained for viability with PI. This staining strategy allows for the detection of dead (CFSE pos+PI+) target cells and dead (CFSE neg+PI+) CAR-T cells.
Imaging and Quantification of CAR T Mediated Cytotoxicity
Celigo Experimental Protocol
- Target cells (adherent or suspension) were collected and stained with tracer dye CFSE
- Target cells were seeded in the wells of microplates
- CAR T cells were added to the wells at different E:T ratios
- At the endpoint, viability dye (PI) is added to determine the viability of target cells
- The wells were scanned and analyzed using Celigo at the endpoint to measure target cell count and viability
- Endpoint percent cytotoxicity data was generated to show cytotoxicity of target cells
Calculating the Cytotoxicity Percentage
The cytotoxicity % is calculated by the equation below.
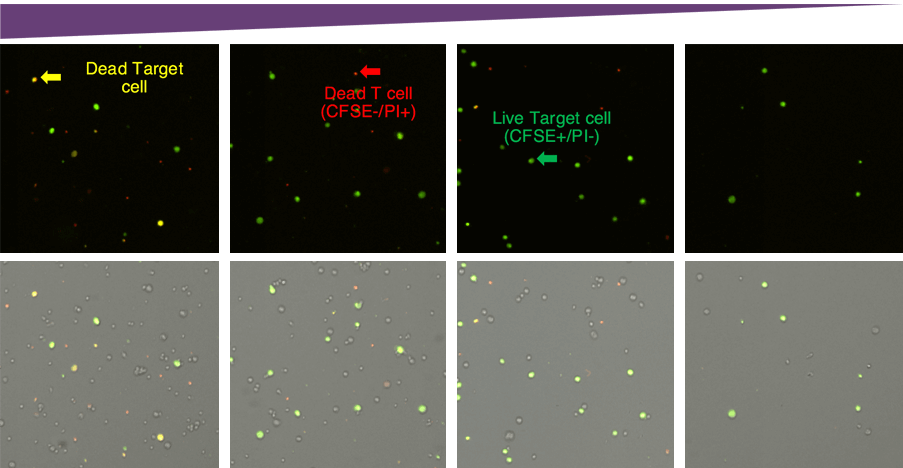
Target and Effector Cell Fluorescent and Bright Field Overlay Images
E:T Ratio

Tumor cells were labeled with CFSE prior to mixing with CAR-T cells. Yellow cells in the red/green merge images represent dead target tumor cells. Propidium iodide only positive cells are dead CAR-T cells. The live target tumor cells are green in color.
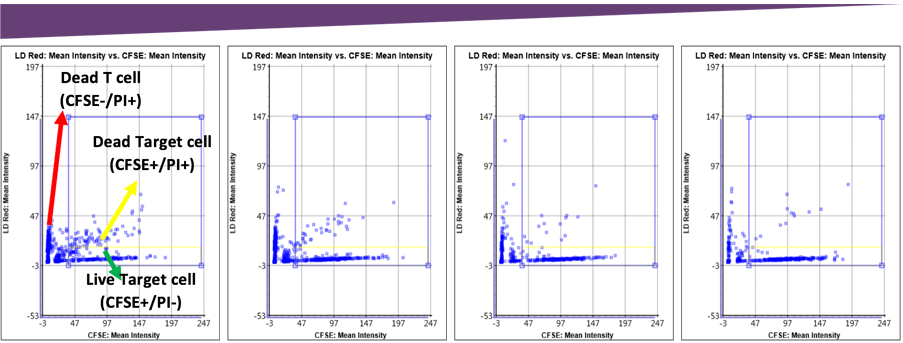
Fluorescent Intensity Gating for Cytotoxicity Percentage
E:T Ratio

The number of dead target cells increased as the E:T ratio increased, which can be visually seen in the scatter plot. The gating allowed the measurement of the number of live and dead target cells to calculate the final cytotoxicity percentage.
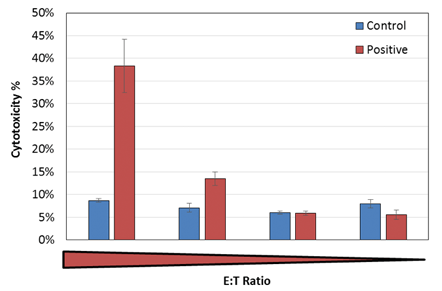
CAR-T E:T Ratio Dependent Cytotoxicity Results

At the endpoint, we observed an E:T ratio dependent increase in measured cytotoxicity percentage.
