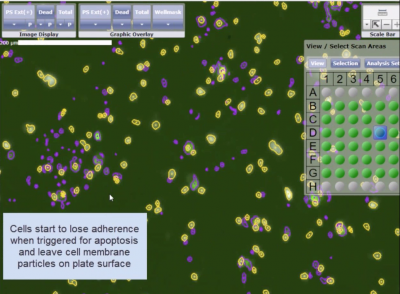
Detection of Apoptotic Events
Introduction to Apoptosis
Apoptosis, or programmed cell death, is a normal process required for maintenance of tissue homeostasis and the regulation of physiological functions. There are two main apoptosis activation pathways: the extrinsic and the intrinsic pathways. The extrinsic pathway is activated by the binding of ligands (including TNFα, FasL, and TRAIL) to cell-surface receptors. The intrinsic, or mitochondrial, pathway is typically activated in response to DNA or cellular damage caused by toxic drugs or UV irradiation. The convergence of the extrinsic and intrinsic pathways occurs at the proteolytic activation of caspase-3.
Currently, the Cellometer Vision CBA system can measure apoptosis by detecting Caspase 3 and 8, JC-1, and Annexin V.
Extrinsic and Intrinsic Apoptosis Pathways
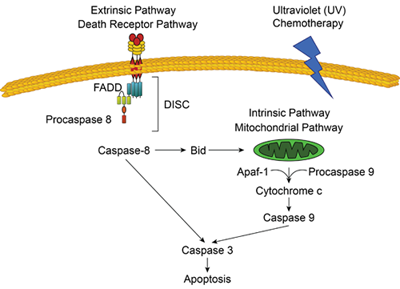
Adapted from The Pathophysiology of Biliary Epithelia ISBN: 1-58706-171-6
Detection of Annexin V and Necrosis
Annexin V Overview
An alternative method of apoptosis detection can be accomplished via Annexin V and propidium iodide (PI) detection. Annexin V is a member of the annexin family of intracellular proteins that binds to phosphatidylserine (PS) in a calcium-dependent manner. In healthy cells PS is normally only found on the intracellular leaflet of the plasma membrane, but during apoptosis, PS translocates to the external leaflet. Fluorochrome-labeled Annexin V can then be used to specifically target and identify the PS on the surface of apoptotic cells. Annexin V binding alone cannot differentiate between apoptotic and late stage apoptotic or necrotic cells. Propidium Iodide solution is a membrane-exclusion dye that enters cells with compromised cell membranes and binds to its DNA. Early apoptotic and healthy cells with intact membranes will exclude PI, while late stage apoptotic and necrotic cells with compromised membranes are stained with PI. Use of both Annexin V-FITC and PI allows researchers to characterize a cell population based on % normal, % apoptotic, and % necrotic /very late-stage apoptotic cells.
A positive control is often necessary to optimize experimental protocols as well as obtain instrumentation baseline. For Cellometer examples, positive controls were generated by treating Jurkat cells overnight with 10 µM α-TOS, an apoptosis inducing pharmacological reagent. Negative control samples were not treated with α-TOS.
Bright Field and Fluorescent Cell Images
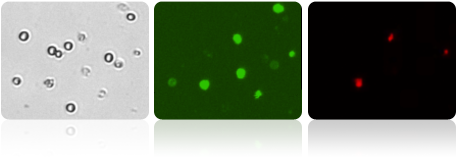
Shown above, three micrographs: a brightfield, Annexin V (green), and PI (red), for an apoptosis positive sample. Fluorescent intensity data from these captured Cellometer images was exported to FCS Express Software.
Fluorescent Intensity Data Plots
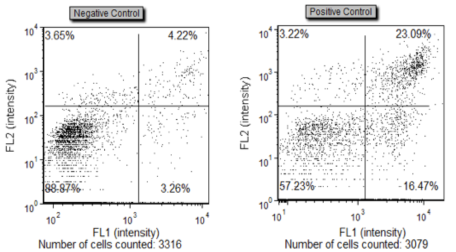
Data is displayed as a scatter plot and each quadrant represents a specific cell population. Lower left-hand quadrant shows live cells that are Annexin V and PI negative. Top left quadrant shows dead/debris cells that are PI positive only. Bottom right quadrant shows apoptotic cells that are Annexin V positive. And the top right quadrant shows necrotic cells that are both Annexin V and PI positive.
Data Table of Cell Population and Concentration
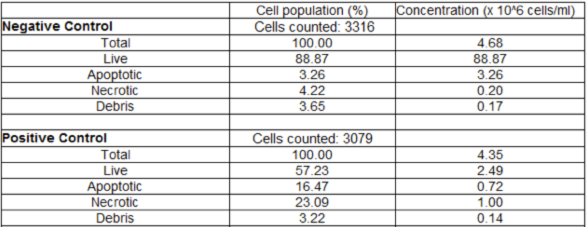
This table displays the Live, Apoptotic, Necrotic, and Debris cell populations.
Detection of JC-1 Activity
JC-1 Overview
Another method for the detection of apoptosis is by examining JC-1, a mitochondrial membrane potential dye. In healthy cells, JC-1 diffuses across the cellular membrane into the cytoplasm where it fluoresces green. Due to cationic properties of JC-1 it migrates into the mitochondria where the net negative charge is -180 mV. As the concentration of JC-1 within the mitochondria increases, JC-1 begins to form aggregates that fluoresce red. However, in cells undergoing apoptosis, or in those that have been treated with a drug (such as CCCP) the loss of mitochondrial membrane potential prevents JC-1 from forming aggregates within the mitochondria and therefore JC-1 fluoresces green in the cytoplasm. The permeabilization of mitochondrial membrane leads to the release of cytochrome c, activation of caspase 9 and caspase 3.
Cultured Jurkat cells were collected and incubated without (control) or with carbonyl cyanide 3-chlorophenylhydrazone (CCCP) to disrupt the mitochondrial membrane potential for 5 min at 37°C
After incubation with CCCP, cells were stained with JC-1 kit (LifeTechnologies): 10 μl JC-1 at 200 µM was added to 1 ml of Jurkat cells (~2×10^6), each sample and incubated in the incubator for 30 minutes. (Washing after the staining is optional, and was not performed in this experiment.)
JC-1 Mode of Action as a Membrane Potential Dye
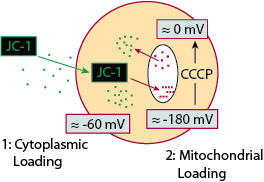
Adapted from Purdue Cytometry CD-ROM Series,volume 3
Control Jurkat Cells
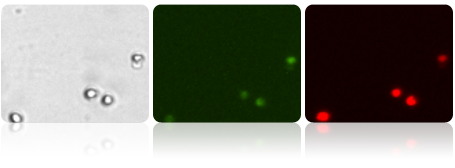
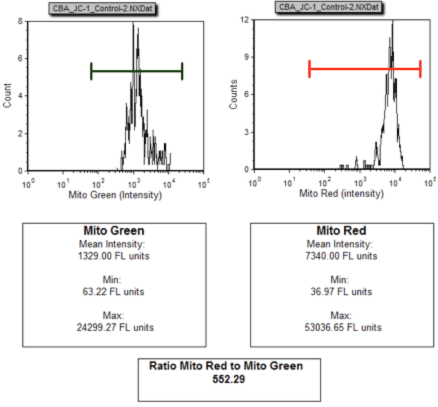
Untreated Jurkat cells were stained with JC-1, imaged on the Cellometer Vision CBA and data exported to FCS Express Software. Healthy cells predominately show an accumulation of Mito Red within the mitochondria as show by the bright red staining and a strong intensity peak for Mito Red at 10^4.
Bright field, Mito Green and Mito Red images of Healthy Jurkat cells
Mean Intensity Data Plots: Control Jurkat Cells
CCCP Treated Jurkat Cells
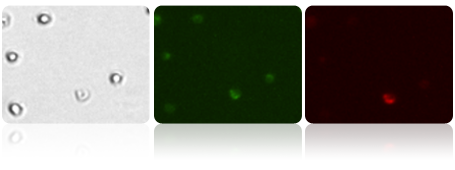
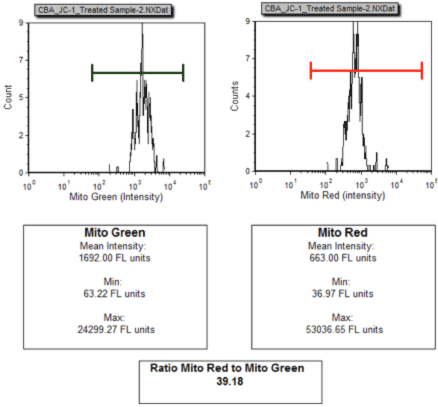
Jurkat cells treated with CCCP (Carbonyl cyanide m-chlorophenyl hydrazone) were stained with JC-1, imaged on the Cellometer Vision CBA and data exported to FCS express. The loss of mitochondrial membrane potential results in the drastic decrease of Mito Red, seen in both the fluorescent image and the generated histogram.
Bright field, Mito Green and Mito Red images of Treated Jurkat cells
Mean Intensity Data Plots: Treated Jurkat Cells
In healthy Jurkat cells, JC-1 formed aggregates in the mitochondria lead to a strong red fluorescent signal. Cells in which the mitochondrial potential was disrupted JC-1 did not form aggregates and therefore very little red fluorescence was observed.
Cellometer acquired multiple images per sample and the cell fluorescence intensities were exported and analyzed in FCS Express. The data was plotted as a histogram of the green and red fluorescence intensity. The decrease in the red/green mean fluorescence intensity (from 552.29 for control to 39.18 for treated) is an indication of the mitochondrial depolarization.
Detection of Caspase 3/8 Activity
Caspase 3/8 Overview
In non-apoptotic cells procaspase 8 and procaspase 3 are inactive cysteine proteases. Upon activation of the apoptosis, a signaling cascade occurs where procaspase-8 is cleaved to the active caspase-8 protease. Caspase-8 quickly converts procaspase-3 to active Caspase-3. Once caspase-3 is activated, a series of irreversible events are set in motion that lead to the death of the cell, including activation of the CAD (Caspase-Activated DNase) endonuclease that degrades DNA within the nucleus and initiates chromatin condensation.
The CaspGLOW™Fluorescein Active Caspase-3 or Caspase 8 Staining Kit offers a simple, sensitive method for detection of active Caspase-3/8 in living cells. When detecting caspase-3, we utilize a specific FITC-conjugated caspase-3 inhibitor, DEVD-FMK (or IETD-FMK for Caspase 8). Both inhibitors, DEVD-FMK and IETD-FMK, are cell-permeable and bind irreversibly to active caspase-3 or caspase 8 within the apoptotic cell. The fluorescent marker (FITC) on the inhibitors allows for the detection of cells undergoing apoptosis.
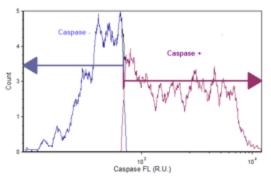
Cellular fluorescent intensity data is plotted as a histogram for each sample. The associated data table displays the percent of cells that are caspase (+) and the percent of the cell population that is caspase (–).
Caspase 3 Positive
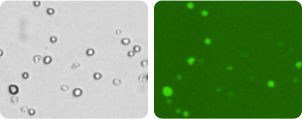
Treated Jurkat cells were imaged and data exported to FCS Express Software. The mean intensity of the caspase signal was plotted as a histogram to determine the percent positive and percent negative of the treated Jurkat populations.
Bright field and Caspase Images of Treated Jurkat Cells
Data Plot for Caspase Positive Activity
| Cell Population | % of cells | Concentration (x 10^6 Cells/ml) |
|---|---|---|
| Total | 100.00 | 2.80 |
| Caspase + | 57.44 | 1.61 |
| Caspase – | 42.36 | 1.18 |
Caspase 3 Negative
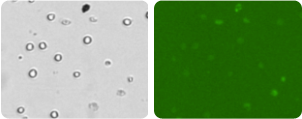
Control Jurkat cells were imaged and data exported to FCS Express Software. The mean intensity of the caspase signal was plotted as a histogram to determine the percent positive and percent negative of the control Jurkat populations.
Bright field and Caspase Images of Control Jurkat Cells
Data Plot for Caspase Negative Activity
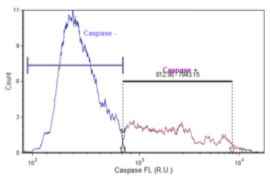
| Cell Population | % of cells | Concentration (x 10^6 Cells/ml) |
|---|---|---|
| Total | 100.00 | 4.52 |
| Caspase + | 30.04 | 1.36 |
| Caspase – | 69.84 | 3.15 |
Cellometer Image Cytometry for Apoptosis Detection
Detection of Apoptosis in 4 Easy Steps
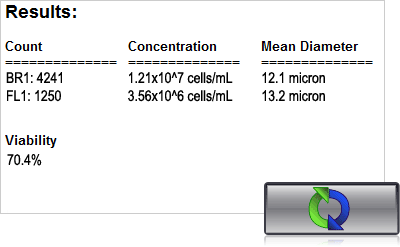
With the Cellometer K2 or Vision CBA, just 20 µl of sample is added to the Cellometer Counting Chamber. Imaging and analysis of the samples is completed in less than 30 seconds. Bright field and fluorescent cell images can be viewed to check cell morphology and verify cell counting. Total cell count, concentration, and mean diameter are automatically displayed.
1. Pipette 20 µl of sample into a disposable slide.
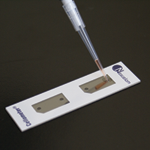
2. Insert slide into the instrument

3. Select assay from a drop down menu
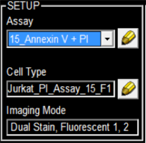
4. Click count, acquire image and view cell count, concentration, diameter
Conclusions
Cellometer image cytometry is a robust system that is capable of detecting cellular apoptosis via multiple methods. Early apoptotic events can be measured by detecting Caspase 8, Caspase 3, and JC-1. A downstream consequence of the activation of the apoptotic cascade is the translocation of to phosphatidylserine to the outer leaflet of the cellular membrane where it can be detected by Annexin V. Finally, cells that have progressed through apoptosis and into necrosis may be detected by propidium iodide.
Publications Using Cellometer for Apoptosis Detection
- Berger EA, McClellan SA, Vistisen KS, Hazlett LD. (2013) HIF-1α Is Essential for Effective PMN Bacterial Killing, Antimicrobial Peptide Production and Apoptosis in Pseudomonas aeruginosa Keratitis. PLoS Pathogens 9(7)
- Verma M, Shulga N, Pastorino JG. (2013) Sirtuin-3 Modulates Bak/Bax Dependent Apoptosis. Journal of Cell Science 126(1):274-88
- Yedjou CG, Saeed MA, Alamgir Hossain M, et al. (2012) Basic apoptotic and necrotic cell death in human liver carcinoma (HepG(2) ) cells induced by synthetic azamacrocycle. Environmental Toxicology 28(8)9
- Chan LL, Lai N, Wang EA, et al. (2011) rapid detection method for apoptosis and necrosis measurement using the Cellometer imaging cytometry. Apoptosis16(12):1295-303

