iPSC Colony Counting
iPSC Reprogramming Introduction
Here we provide a live cell analysis method for the Celigo image cytometer to combine the advantages of microscope imaging and flow cytometry population analysis in a plate-based kinetic assay for the study of iPSC reprogramming.
- Follow iPSC reprogramming over time without trypsinization
- Image, record and detect all the colonies in the whole well of 6-well plates
- Faster assay (7 minutes to read a 6-well plate)
- High proliferation rate of iPSC and death of feeder cell will not affect results, compared to FC analysis
Using a transgenic MEF cell line containing mOrange OKSM and GFP Nanog we were able to track the evolution of iPSC colonies by detecting the production of orange colonies and the subsequent evolution of green colonies.
Disadvantage of Microscope Analysis for iPSC Reprogramming
- Can only follow a small number of colonies throughout the reprogramming
- Colonies chosen to follow the reprogramming process may not be ideal examples
- Finding the same focal plane not always possible
- Images need to be exported and analyzed on a separate image processing software package
Disadvantage of Flow Cytometer Analysis for iPSC Reprogramming
- Must trypsinize stem cell colonies into a single-cell suspension
- Cell population analysis doesn’t reflect colonies varying in size and composition
- Interference from MEF cells and dead cells due to trypsinization and manipulation
- Destructive and requires a new sample for each time point
Live Cell Analysis of iPSC Reprogramming Experiment 1
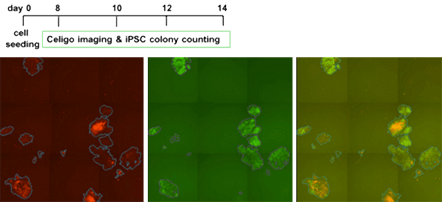
Count mOrange+ colonies, Nanog GFP and green and red overlay images
- Plate at 5×10⁴ transgenic murine embryonic fibroblast (TMef) and 1×10⁵ wild type (WTMef) in 6-well gelatin-coated costar plate (cat # 3516).
- Doxycycline induction of Yamanaka factors produce mOrange colonies, and upon preprogramming progression, colonies start to express Nanog GFP. Media is replenished every two days and contains Doxycycline to keep reprogramming on track. Nanog GFP normally appears at D8, so that is when imaging and colony counting starts.
- To monitor the progression of reprogramming, the plates were scanned and analyzed to score total colonies and green colonies every two days from d2 – d14.
Data courtesy of Kaji Lab, MRC Centre for Regenerative Medicine, University of Edinburgh.
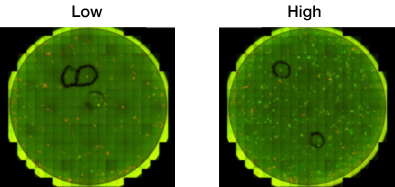
| Reprogramming | # of Colonies | # of orange colonies | # of green colonies | % Reprogramming |
|---|---|---|---|---|
| Low | 200 | 200 | 50 | 25 |
| High | 700 | 700 | 600 | 86 |
Live Cell Analysis of iPSC Reprogramming Experiment 2
Current Practice in iPSC Reprogramming Analysis
A combination of microscope and flow cytometry analysis were used to analyze iPSC reprogramming. The microscope was used to visualize reprogramming. One or two representative colonies were chosen to image throughout the process. These colonies were identified using a marker pen for identification. iPSC antigen expression was then examined using flow cytometry post-trypsinization.
Whole-well Image from 6-well Plate
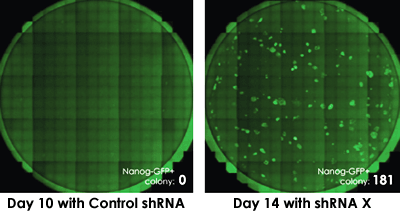
Monitoring the formation and number of Nanog+ colonies
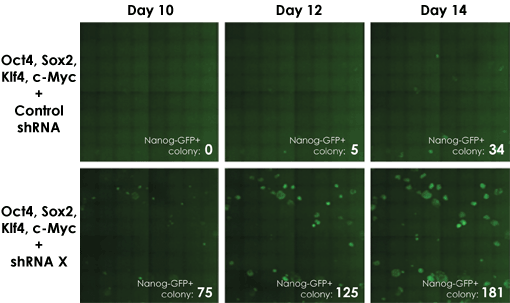
The Celigo assay allows researchers to investigate other factors involved in the reprogramming process. In this example, the addition of sHRNA for factor x enhanced the production of Nanog-expressing colonies. From this data we can summarize that factor x acts upstream of OKSM and downstream of Nanog and may play a key role in iPSC reprogramming.
Monitor Human Fibroblasts Reprogramming Experiment Over Time
Colony formation post transduction
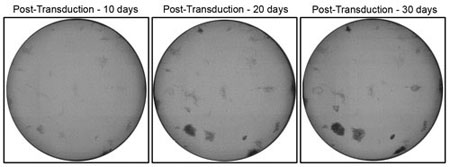
Whole-well imaging of human fibroblasts reprogramming experiments monitored in 12-well plates using the Celigo at 10, 20 and 30 days post-transduction.
hESC image acquisition on Celigo
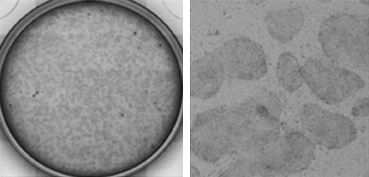
Live whole-well (12-well plate; left) and zoomed images (right) of hESCs. Images courtesy of B. Nelson, N. Kan, M. Mercola, Sanford-Burnham Medical Research Institute.
Live Cell Analysis of Stem Cell Pluripotency
Stem Cell Characterization
Stem cell cultures growing in any standard well plate format can be quickly scanned and assessed using the Celigo cell imaging cytometer, greatly reducing the time and effort needed to characterize these complex cultures. Whole-well bright field and/or fluorescent images are rapidly acquired to allow analysis of stem cell culture health, differentiation status and splitting times/ratios. The Celigo cytometer can also be used to evaluate the expression of stem cell-associated proteins. Cultures can be observed over time by repeated imaging of the same plate to monitor the progression of reprogramming and differentiation events.
Surface marker live cell staining
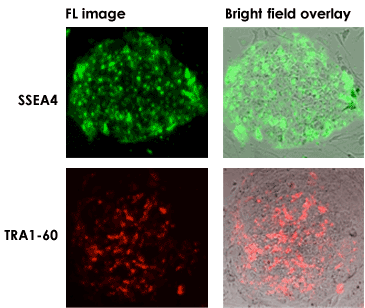
Celigo Imaging Cytometer Stem Cell Culture Analysis Advantages
- Rapid, whole-well imaging of stem cell cultures (96-well to 6-well; scan an entire 6-well plate in ~10 min)
- Images acquired and stitched in bright field plus up to 4 fluorescent channels
- Tracking of live stem cell cultures to analyze differentiation status
- Analysis of staining patterns using live and fixed stem cells
- Eliminate tedious collection and analysis of images with conventional microscopy
Stem Cell Characterization on Celigo Cell Imaging Cytometer

Whole-well (6-well plate; left) and zoomed images (middle, right) of hiPSCs stained with characteristic stem cell markers.
