Ale and Lager Yeast
Introduction
The brewing and wine industries rely predominantly on the yeast Saccharomyces cerevisiae. In order to optimize fermentation processes, it is important to characterize the physiological and metabolic (the viability and vitality, respectively) of the yeast cells throughout the procedure. Yeast are viable when the cells have intact membranes. Vitality, on the other hand, is defined by quantifiable metabolic activity as well as the ability to proliferate. It is possible to have yeast that are viable but not actively proliferating, an event which can adversely affect fermentation.
Automated cell counting methods can monitor yeast concentration and viability throughout fermentation to ascertain cell health and the amount of yeast to be pitched or repitched, all of which contributes to the quality and flavor consistency of the final product [1,2,3]. Analyzing physiological and metabolic characteristics of the yeast cells permits operators to efficiently monitor yeast viability and vitality for quality control purposes, which impacts long-term storage and other physiological stresses [4,5].
Traditionally, methylene blue has been implemented to measure yeast viability. The metachromatic stain can distinguish between live and dead cells using basic bright field microscopy [6,7]. Vital yeast cells convert methylene blue to a colorless solution via cellular dehydrogenase, while non-vital cells remain blue. Consequently, methylene blue is a tool for both viability and vitality analysis as it measures enzymatic activity [8]. Even though this dye is considered the gold standard for the brewing industry, this method is time-consuming and susceptible to human error that results in user-dependent variations [5]. New fluorescent dyes that assess principles such as membrane integrity, membrane potential (oxonol (DiBAC4(3)), intracellular conversion (magnesium salt of 1-anilino-8-naphthalene sulfonic acid (MgANS)), and metabolic activity (carboxyfluorescein diacetate, acetoxymethyl ester (CFDA-AM)) have recently become available to analyze yeast viability and vitality [1,2,5,9-15]. Other stains such as propidium iodide (PI), ethidium bromide (EB), 4′,6-diamidino-2-phenylindole (DAPI), and 7-aminoactinomycin D (7-AAD), are membrane impermeable dyes that penetrate only membrane-compromised yeast, thereby identifying nonviable cells [5,10,11,13,16]. Dual staining methods acridine orange (AO) and PI can determine yeast viability, while CFDA-AM and PI can determine yeast vitality. When AO/PI encounters nonviable cells, the fluorescent emission is transferred from AO to PI due to fluorescence energy resonance transfer (FRET), resulting in viable yeast appearing green and nonviable appearing orange. The CFDA-AM/PI combination results in the metabolically active yeast appearing green and the non-active yeast appearing orange. These dyes greatly enhance the characterization of yeast, and yet a lack of automation means that they can also be time-consuming. Automation with flow cytometry provides a high throughput process but can be costly to operate and maintain and requires the presence of highly trained operators. Also, with no imaging capabilities, uncertainties with the data may persist. An image-based cytometric system can alleviate these challenges with both bright field and fluorescent imaging and automated cell-based analysis, all of which improves the efficiency and accuracy of yeast research.
Our past research has illustrated the ability of image cytometry to ascertain physiological parameters such as viability, vitality, glycogen, neutral lipid and trehalose content [17]. Additionally, we have shown a significant difference in viability and vitality measurements of yeast cultures from lag to stationary phases. The data emphasize that even though yeast were viable as reported by AO/PI, metabolic activity varied. Here, we further demonstrate the abilities of image cytometry to analyze yeast viability and vitality with multi-fluorescent staining tools within the context of two fermentation processes routinely performed by Avery Brewing Company (Boulder, CO). We validated these methods using both fresh and heat-killed yeast mixtures. The yeast cells were stained with the various dyes and dye combinations (PI, EB, DAPI, 7-AAD, oxonol, MgANS, CFDA-AM, AO/PI, and CFDAAM/PI) and all results were compared to those derived from manual counting using methylene blue. The viability and vitality of two specific lager and ale yeast strains were measured over a time course during fermentation by staining the cells separately with PI for viability and CFDA-AM for vitality. Also, this process was demonstrated in a brewery setting to efficiently characterize yeast viability and vitality throughout the entire course of fermentation. We believe these data demonstrate that this image cytometry method is widely applicable to various fermentation processes and may help brewers to more consistently produce beverage products of the highest quality.
Materials and Methods
Image-Based Cytometry with Cellometer Vision
The Cellometer Vision has been previously described elsewhere [17-19,21]. The instrument uses bright field and two fluorescent imaging modes to measure yeast cell concentrations and viability. Each yeast sample (20 µL of a mixture of between 5 x 10⁵ and 1 x 10⁷ cells/mL) was added to a Nexcelom counting chamber and bright field and fluorescent images were taken at four locations within the chamber. All images were subsequently analyzed by Cellometer software to count cells, measure fluorescent intensities, and measure cell morphology characteristics such as cell size and circularity.
Preparation of Yeast Cell Cultures
Single colonies of S. cerevisiae strain EBY-100 were inoculated into conical flasks containing YPD media. The cultures were incubated overnight on a shaker and separated into two centrifuge tubes, where one was heat-killed in a boiling water bath for 15 minutes. Fresh and heat-killed cultures were mixed to produce the theoretical viability mixtures of 0, 25, 50, 75, 100% viability.
Methylene Blue Analysis
A working concentration of methylene blue was created (0.01% w/v) and was mixed with five yeast samples of theoretical viabilities from 0 to 100%. A standard hemacytometer was used to count the samples in quadruplicate. All results were compared to those obtained from image cytometry.
Nuclei Acid Viability Stains
PI, EB, DAPI, and 7-AAD stained with the five yeast viability samples from 0 to 100%. PI and EB were analyzed directly after staining. 7-AAD and DAPI were both incubated for 5 minutes at room temperature before cytometric analysis. All samples were measured in quadruplicate and the results were compared to manual methylene blue results.
Viability Analysis using Membrane Potential, Intracellular Conversion, and Enzymatic Stains
CFDA-AM, oxonol, and MgANS stained the five yeast viability samples from 0 to 100%. CFDA-AM was incubated for 45 minutes at 37°C and oxonol and MgANS were both incubated for 5 minutes in the dark at room temperature. All samples were analyzed with the image cytometer, in quadruplicate, and the results were compared to those obtained from manual methylene blue.
Viability Analysis using Dual Stain Methods
AO/PI and CFDA-AM/PI stained the five yeast viability samples from 0 to 100%. AO/PI was analyzed immediately after staining. CFDA-AM samples were incubated for 15 minutes in the dark at 37°C. All samples were imaged in quadruplicate and were compared to manual methylene blue results.
Additionally, AO/PI results were compared in a head-to-head method to methylene blue results over a time course of bioethanol fermentation. Yeast cells were collected at propagation, 2, 5, 10, 25, 30, 40, 50, 60, and 70 hours into the fermentation process. All collected samples were stained with either AO/PI or methylene blue and then analyzed using the image cytometer or hemacytometer, respectively. Yeast cell concentrations and viabilities were compared.
Measuring Viability and Vitality During Lager and Ale Fermentation
Avery Brewery Company used two commercially-available yeast brewing strains, one ale yeast and one lager yeast strain. The yeast cells were propagated in stainless steel conical vessels with 2-4 ppm of oxygen and perpetual aeration for 48 hours in a 10°P wort. After this time, the tank was cooled, yeast cells were pitched into conical stainless steel fermentation vessels with 13.8 and 10.3°P wort for the ale and lager yeast, respectively. Ale yeast fermented for 6 days and lager yeast fermented for 14 days. The initial cell count for both yeast strains were 1 x 10⁶ cells/mL/°P. Viability was measured with PI and vitality by CFDA-AM every 24 hours throughout the study. Initial measurements were taken when the yeast arrived from the supplier, then once every day through 2-3 days of yeast propagation, again at the “first knockout” when the yeast and wort are initially combined in the fermentation tank, and then every 24 hours after during fermentation. Tanks were then cooled to 0°C to precipitate yeast flocculation, then readied for processing and packaging at a time point called “crash”. Viability and vitality analyses were carried out daily until the tank was crash cooled. All samples were taken from the middle of the tank, where active yeast are present but does not include the yeast cells that had already flocculated and were therefore no longer in suspension.
The fermentation of ale yeast was maintained at a constant 18°C until the beer was roughly 70% attenuated, at which the temperature was raised to 22°C to permit diacetyl rest. This temperature alteration took place approximately 30 hours after the “last knockout” time point, in which the entire volume of wort was mixed with the yeast in the fermentation tank. After cooling, yeast cell counts fell dramatically as yeast began to flocculate. The fermentation of lager yeast was kept at 13°C until 70% attenuation, at which the temperature was raised to 18°C to permit diacetyl rest. For the lager yeast, this temperature fluctuation occurred much later during fermentation, at approximately 115 hours after the last knock out.
Image Cytometric Analysis
The appropriate FOMs were used to detect the emission wavelengths for each stain. The nucleic acid viability stains used: VB-450-302 (EX: 375 nm, EM: 450 nm), VB-595-502 (EX: 525 nm, EM: 595 nm)/ VB-660-503 (EX: 540nm, EM: 660 nm) were used to detect DAPI, PI/EB, and 7-AAD, respectively. For membrane potential, intracellular, and enzymatic viability stains: VB-535-402 (EX: 470 nm, EM: 535 nm) was used to detect CFDA-AM and oxonol. VB-535-302 (EX: 375 nm, EM: 535 nm) was used to detect MgANS. For dual staining methods, VB-535-402 and 660-503 were used for CFDA-AM/AO and PI, respectively. Three equations were used by the Nexcelom software for viability calculations (see below). Nucleic acid membrane integrity, membrane potential, and intracellular staining methods utilized equation 1. Enzymatic staining viability utilized equation 2. In equations 1 and 2, FL represents nonviable and viable cells, respectively. Dual staining methods utilized equation 3, where FL1 and FL2 represent the total number of viable and nonviable cells, respectively.
Equation 1: Viability = (BR-FL)/FL x 100%
Equation 2: Viability = FL/BR x 100%
Equation 3: Viability = FL1/(FL1+FL2) x 100%
Results
Validation of Nucleic Acid Stains
Bright field images of methylene-blue stained yeast can be seen in Figure 1 at the various theoretical viability concentrations.
Membrane-compromised yeast cells were stained with 7-AAD, DAPI, PI, and EB.
Cells were counted via bright field and nonviable cells were detected with fluorescence.
Bright field and fluorescent images for each dye can be seen in Figure 2a.
Figure 2b shows the viability comparisons for each dye. There was a high correlation between each dye and between the theoretical and experimental viabilities (P≥0.05).
Figure 1

Bright field images of methylene blue-stained yeast at the five viability percentages. As the theoretical viability decreased, the number of blue-stained cells increased.
Figure 2a
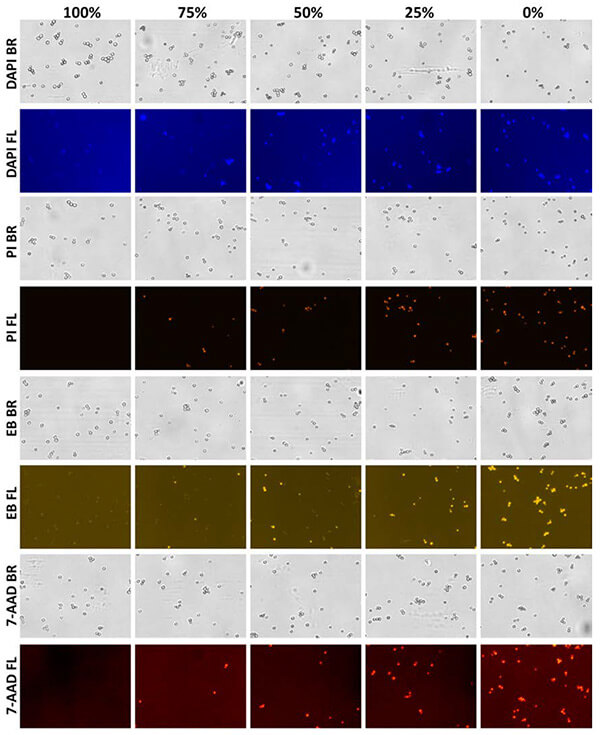
Bright field and fluorescent images of yeast cells stained with the nucleic acid integrity dyes
Figure 2b
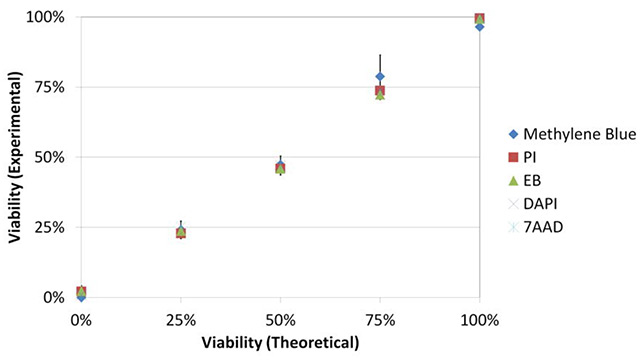
Correlation between each dye’s viability and between the theoretical and experimental viabilities
Validation of membrane potential, intracellular conversion, and enzymatic stains
Nonviable yeast were stained with oxonol and MgANS and metabolically active yeast were stained with CFDA-AM.
Bright field and fluorescent images are displayed in Figure 3a. Oxonol and MgANS reported increasing number of fluorescent cells, while CFDA-AM reported the opposite. All three stains displayed comparable viability results (Figure 3b), and there was a high correlation between the experimental and theoretical viabilities.
Figure 3a
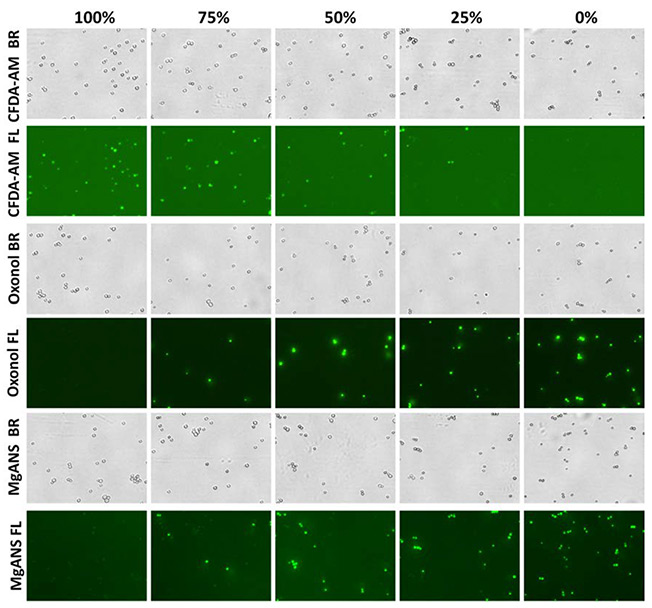
Bright field and fluorescent images of membrane potential, intracellular conversion, and enzymatic stains.
Figure 3b
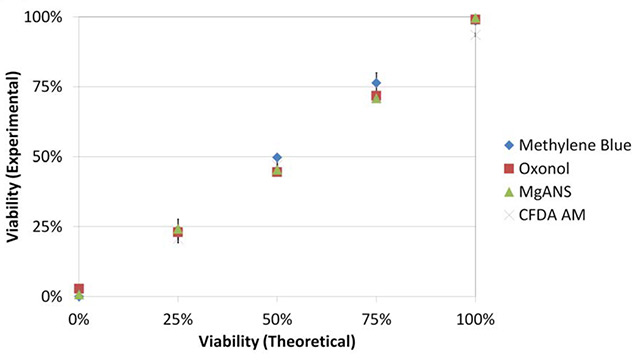
Correlation between each dye’s reported viability and between the experimental and theoretical viabilities
Dual Staining Method Viabilities
Bright field and fluorescent images of AO/PI and CFDA-AM/PI are shown in Figure 4a. Viable and vital yeast cells are pseudo-colored green and nonviable cells are pseudo-colored orange.
Using equation 3, both dual staining methods were comparable (P≥0.05) to those obtained with methylene blue (Figure 4b). The experimental and theoretical viabilities were also highly correlated (R2>0.99).
In the time-course of bioethanol fermentation, AO/PI and methylene blue reported highly comparable concentration and viability data (Figure 5). Concentration (5a) and viability (5b) trends from both detection methods were similar, validating the nucleic acid staining methods against the current industry standard.
Figure 4a
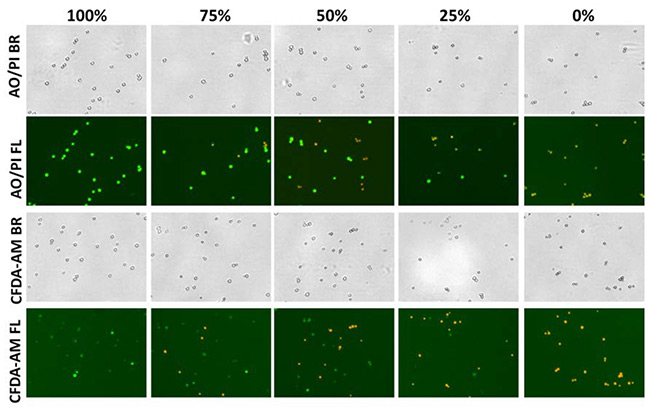
Bright field and fluorescent images of AO/PI and CFDA-AM/PI samples
Figure 4b
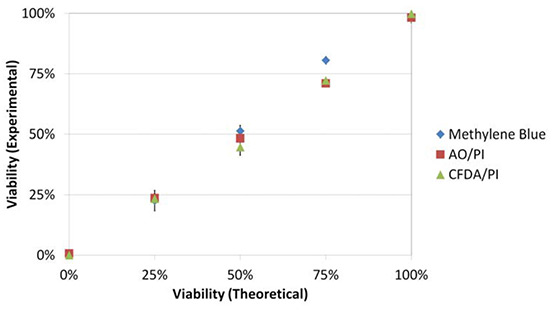
Correlation between the dyes and methylene blue as well as between the experimental and theoretical viabilities
Figure 5a
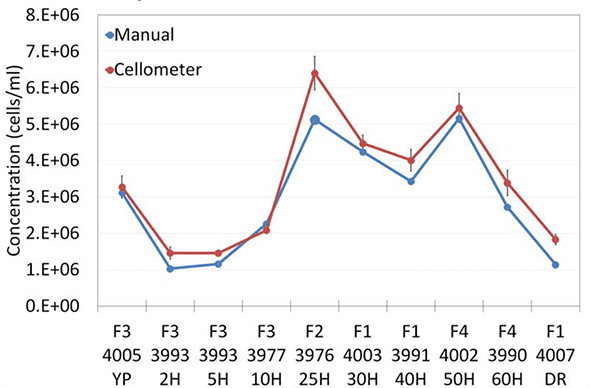
Concentration in the time-course bioethanol fermentation study
Figure 5b
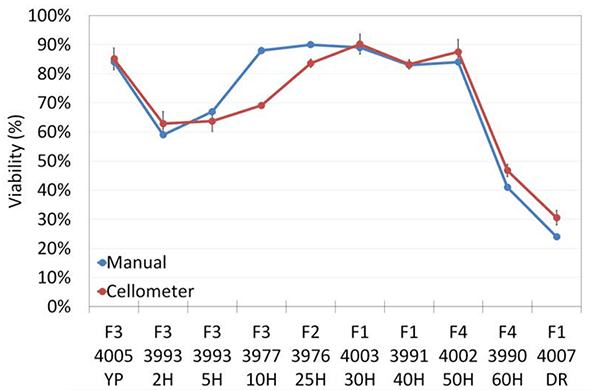
Viability in the time-course bioethanol fermentation study.
Viability and Vitality in the Ale and Lager Yeast Strains
In both the ale and lager yeast strains, PI-determined viability throughout fermentation remained mostly constant, stabilizing in the mid to high 90% range with a coefficient of variation (CV) of 2.11 and 1.27%, respectively (Figure 6).
Vitality results demonstrated increasing and decreasing trends in response to changing physiological (i.e. sugar depletion, O2, and ethanol concentration) and mechanical (i.e. temperature or recirculation rates) conditions.
Lager yeast vitality, as measured by CFDA-AM, reported consistently high vitality of approximately 96% until directly before the crash cooling of the fermentation tank, when the vitality decreased to roughly 78% (6a).
Ale yeast vitality was high during propagation, but after a period of 3 days, vitality declined until it read, at last knock out, approximately 50%. After last knock out, vitality increased to ~94% until “terminal gravity”, when all of the sugar is consumed. The vitality then decreased sharply to roughly 10% when the fermentation tank was crash cooled (6b).
Initial cell count of lager yeast was 1.5 x 10⁷ cells/mL and increased four fold during propagation but then decreased due to dilution at first knock out. Yeast cell number continued to increase even beyond terminal gravity, but due to flocculation, the number fell again to approximately 2 x 10⁷ cells/mL (6c).
Ale yeast cell concentration rose quickly to approximately 7 x 10⁷ cells/mL until the dilution at pitching. Over the course of fermentation, yeast proliferated only three fold up to 3 x 10⁷ cells/mL until terminal gravity, when high flocculation decreased the yeast cell number to ~1 x 10⁵ cells/mL (6d).
Figure 6a & 6b
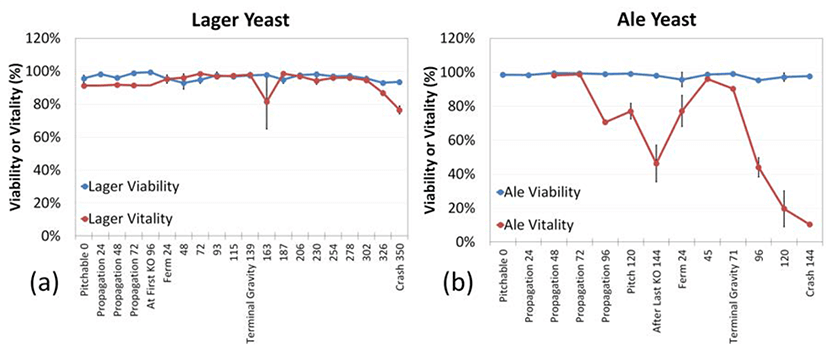
Viability time-course study in lager and ale yeast fermentation
Figure 6c & 6d
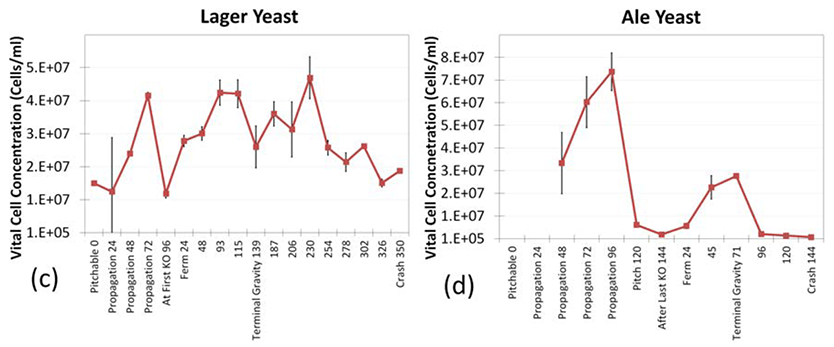
Vitality time-course study in lager and ale yeast fermentation
Discussion
Validation of Fluorescent Dyes for Yeast Viability and Vitality
Image-based cytometry provided rapid, efficient, and routine monitoring of the physiological and metabolic characteristics of yeast throughout fermentation.
Multiple fluorescent-based viability and vitality methods were validated in this work against the gold standard methylene blue.
All fluorescent stains yielded highly comparable results with those obtained via manual hemacytometer counting, in a manner that was more rapid and introduced less user-dependent error.
Nucleic Acid Dyes
PI and EB bind to DNA non-selectively which greatly enhances their fluorescent intensities but can also generate nonspecific staining [20].
DAPI, on the other hand, specifically binds to DNA’s minor grooves and yet it may also stain live cells and RNA at higher concentrations [2].
7-AAD binds specifically to GC regions within DNA and does not enter live cells.
Differences between the measured viabilities between all nucleic acid dyes and methylene blue at each viability percentage were less than 5% (Figure 2b).
Membrane Integrity, Membrane Potential, Intracellular Conversion, and Enzymatic Staining Dyes
Differences between the stains for membrane integrity, membrane potential, intracellular conversion, and enzymatic staining also showed less than 5% variability between all dyes and methylene blue at each viability percentage.
Of all methods explored here, PI and CFDA-AM generated the highest fluorescent intensities and contrast.
Dual Staining Methods
Of the dual staining methods, AO/PI and CFDA-AM/PI also showed comparable viability results to those obtained via methylene blue.
CFDA-AM did demonstrate a decrease at the addition of PI, suggesting that PI may produce an unknown, nonspecific quenching to the mixture. Therefore, it may be advisable to perform enzymatic staining independent of PI-based viability staining.
Past research suggests that methylene blue is not accurate if viability is below 70%possibly due to unstable cell membranes in cells undergoing apoptosis [18].
Viability and Vitality in a Brewing Fermentation Process
PI was used to study viability and CFDA-AM vitality for both lager and ale yeast strains.
Both strains showed high viabilities (above ~95%) throughout fermentation.
Vitality, however, showed more noticeable trends due to various environmental factors experienced during fermentation.
This work confirmed that though a sample may contain a high number of viable yeast, the vitality of those yeast greatly varies.
For the lager yeast, vital cells rose during propagation to ~95% which decreased at the first knock out due to the dilution at the addition of wort. Yeast vitality remained high due to readily available sugars and oxygen, producing a peak 93 hours into fermentation. For the rest of fermentation, a gradual decline in vital cells was seen at each subsequent time point probably due to sugar depletion, increased ethanol, and temperature fluctuations that can prompt flocculation [18]. Still, the vitality of these yeast remained high until the tank was cooled.
For the ale yeast, vital cell numbers also rose during propagation. Initial vitality was high but over the next 3 days, it declined to ~50%, which may be due to crowding-induced stress. After the pitch, yeast vitality rose to over 95% during fermentation. Cell concentration fell when the yeast were diluted by the addition of wort. The ale strain underwent a more rapid fermentation than the lager strain, with the concentration of vital cells and vitality peaking at terminal gravity. After terminal gravity, flocculation commenced, decreasing the concentration of vital cells.
Despite the fact that the two strains showed similar viability profiles, the vitality measurements were quite different. The lager strain demonstrated high vitality throughout fermentation that seemed unchanged by physiological and mechanical changes in the dark. The ale yeast, however, seemed significantly affected by tank conditions.
The replicative capacity of yeast was one parameter not examined in this study.
Conclusions
Here, we demonstrated the abilities of image cytometry to carry out multi-fluorescent-based viability and vitality measurements on yeast cells.
These measurements were successfully performed during a time course in a full-scale industrial brewing process.
The physiological and metabolic characteristics of yeast are of primary importance to brewers as poor yeast health can lead to variable production yields and flavors in beverage products, making the monitoring of these characteristics especially important to ensure a high quality product.
Image cytometry allows these characteristics to be monitored in real time in an efficient, rapid, and automated way that reduces user-dependent variation and increases accuracy.
In future experiments, it would be useful to analyze the unique growth parameters, such as osmotic stress, alcohol content, and intracellular glycogen reserves, necessary to efficiently propagate different beverage brand.
References
- Imai, T., Nakajima, I., and Ohno, T. Development of a new method for evaluation of yeast vitality by measuring intracellular pH. J. Am. Soc. Brew. Chem. 52:5-8, 1994.
- McCaig, R. Evaluation of the fluorescent dye 1-anilino-8-naphthalene sulfonic acid for yeast viability determination. J. Am. Soc. Brew. Chem. 48:22-25, 1990.
- Slaughter, J. C., and Nomura, T. Intracellular glycogen and trehalose contents as predictors of yeast viability. Enzyme. Microbol. Technol. 14:64-67, 1992.
- Jenkins, D. M., Powell, C. D., Fischborn, T., and Smart, K. A. Rehydration of active dry brewing yeast and its effect on cell viability. J. Inst. Brew. 117:377-382, 2011.
- Van Zandycke, S. M., Simal, O., Gualdoni, S., and Smart, K. A. Determination of yeast viability using fluorophores. J. Am. Soc. Brew. Chem. 61:15-22, 2003.
- Sami, M., Ikeda, M., and Yabuuchi, S. Evaluation of the alkaline methylene blue staining method for yeast activity determination. J. Ferm. Bioeng. 78:212-216, 1994.
- Smart, K. A., Chambers, K. M., Lambert, I., Jenkins, C., and Smart, C. A. Use of methylene violet staining procedure to determine yeast viability and vitality. J. Am. Soc. Brew. Chem. 57:18-23, 1999.
- Li, W., Guo, Z., Zhang, L., and Ding, Z. A novel and rapid method for yeast vitality evaluation based on the methylene blue dye reduction test. J. Am. Soc. Brew. Chem. 69:44-49, 2011.
- Aabo, T., Glückstad, J., Siegumfeldt, H., and Arneborg, N. Intracellular pH distribution as a cell health indicator in Saccharomyces cerevisiae. J. Royal Soc. Interface. 8:1635-1643, 2011.
- Corliss, D. A., and White, W. E. Jr. Fluorescence of yeast vitally stained with ethidium bromide and propidium iodide. J. Histochem. Cytochem. 29:45-48, 1981.
- Hernlem, B., and Hua, S.-S. Dual fluorochrome flow cytometric assessment of yeast viability. Curr. Microbiol. 61:57-63, 2010.
- Raschke, D., and Knorr, D. Rapid monitoring of cell size, vitality, and lipid droplet development in the oleaginous yeast Waltomyces lipofer. J. Microbiol. Meth. 79:178-183, 2009.
- Slater, M. L. Rapid nuclear staining method for Saccharomyces cerevisiae. J. Bacteriol. 126:1339-1341, 1976.
- Thiele, F., and Back, W. Measurement of yeast vitality using a modified version of the intracellular pH measurement (ICP). Monatsschr. Brauwiss. 58:2-5, 2005.
- Weigert, C., Steffler, F., Kurz, T., Shellhammer, T. H., and Methner, F.-J. Application of a short intracellular pH method to flow cytometry for determining Saccharomyces cerevisiae vitality. Appl. Environ. Microbiol. 75:5615-5620, 2009.
- Autio, K., and Mattila-Sandholm, T. Detection of active yeast cells (Saccharomyces cerevisiae) in frozen dough sections. Appl. Environ. Microbiol. 58:2153-2157, 1992.
- Chan, L. L., Kury, A., Wilkinson, A., Berkes, C., and Pirani, A. Novel image cytometric method for detection of physiological and metabolic changes in Saccharomyces cerevisiae. J. Ind. Microbiol. Biotech. 39:1615-1623, 2012.
- Chan, L. L.-Y., Kuksin, D., Laverty, D. J., Saldi, S., and Qiu, J. Morphological observation and analysis using automated image cytometry for the comparison of trypan blue and fluorescence-based viability detection method. Cytotechnology DOI:10.1007/s10616-014-9704-5, 2014.
- Chan, L. L., Lyettefi, E. J., Pirani, A., Smith, T., Qiu, J., and Lin, B. Direct concentration and viability measurement of yeast in corn mash using a novel imaging cytometry method. J. Ind. Microbiol. Biotech. 38:1109-1115, 2010.
- Lloyd, D., and Dinsdale, G. From brightfield to fluorescence and confocal microscopy. In: Brewing Yeast Fermentation Performance. K. A. Smart, ed. Blackwell Science, Oxford. Pp. 3-9, 2000.
- Laverty, D. J., Kury, A. L., Kuksin, D., Pirani, A., Flanagan, K., and Chan, L. L.-Y. Automated quantification of budding Saccharomyces cerevisiae using a novel image cytometry method. J. Ind. Microbiol. Biotech. 40:581-588, 2013.
