Cell Size Assay
Introduction to Cell Size Measurement
Cell size measurement is a common assay performed by researchers across multiple disciplines: from determining differentiation capacity of stem cells 1, to measuring adipocyte size 2, to using Sf9 cells and baculovirus to produce recombinant adeno-associated virus. 3
The current method for measuring cell size typically consists of capturing a microscope image and using secondary software to measure the diameter of the cell. The Cellometer system performs these tasks in less than 30 seconds per sample!
A498 Cells
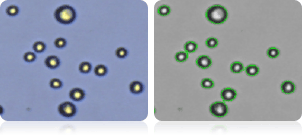
Image showing A498 cells (right) and all cells counted (left) indicated by green cell outlines.
Counted A498 Cells > 15 µm in Diameter

Image showing A498 cells (right) and only cells > 15µm counted (left). Counted cells are confirmed by green outlines. Cells that are < 15 µm are not counted.
The Cellometer uses an “Accurate Cell Membrane Outline Algorithm” that produces the cell membrane outline around each cell. When the counting is complete, a green outline is produced for each counted cell. This sophisticated algorithm allows for consistent identification of the desired cell population and provides reliable and accurate cell counts, concentration, viability and cell size measurements.
Furthermore, since cell size parameters can be customized in the Cellometer software, the user has the capability to count only those cells that fall within the designated cell size. In this case (shown above far right) only cells that are between 15 and 30 microns were counted.
Measuring Cell Size of NCI-60 Cancer Cell Lines
The ability to measure cell size has been a valuable tool for researchers examining the effects of pharmacological agents on cancer cells. Many of the NCI-60 cancer cell lines have distinctly different morphological characteristics and cell sizes.
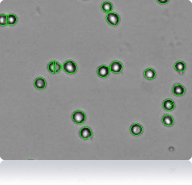
The Cellometer uses an “Accurate Cell Membrane Outline Algorithm” that produces the cell membrane outline around each cell. When the counting is complete, a green outline can be seen around each counted cell. This sophisticated algorithm allows for consistent identification of the desired cell population and provides reliable and accurate cell counts, concentration, viability and cell size measurements. After each count a cell diameter histogram is automatically generated representing the cell size distribution of the counted population.
786-O cells
Cellometer counted 786-O cells
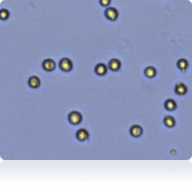
Trypan Blue stained 786-O cells
786-O Cell Diameter Histogram
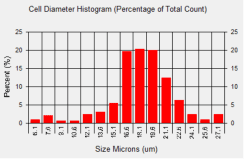
In this experiment average cell diameter for 786-O cells was measured to be 17.6 microns. From the cell diameter histogram, we can estimate that approximately 60% of the cells had a cell diameter that was between 16.6 and 18.6 microns.
SW-620 Cells
Trypan Blue stained SW-620 cells
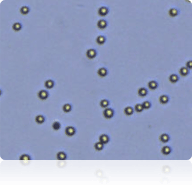
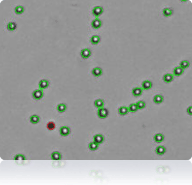
Cellometer counted SW-620 cells
SW-620 Cell Diameter Histogram
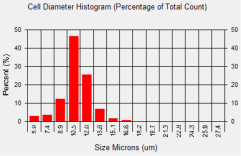
In comparison to 786-O cells, the average diameter of SW-620 cells was measured to be 11.1 microns. Looking at the cell diameter histogram, approximately 75 % of the cells had a cell diameter that was between 10.5 and 12.0 microns.
Measuring the Size of SF9 During Protein Expression
SF9 Cell Images
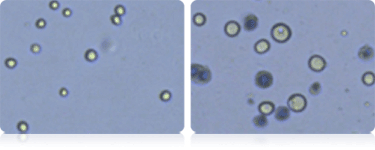
Cell size, concentration and viability of SF9 cells was measured before and during protein expression. The micrograph on the left shows small cells with an average diameter of 13.0 microns. This population is displayed in the “Cell Diameter Histogram” with green bar lines. The size of SF9 cells increases during protein expression and in the micrograph on the right the average cell size is 23 microns in diameter.
SF9 Cell Diameter Histogram

Counting Mature Dendritic Cells Cultured from a PBMC Sample
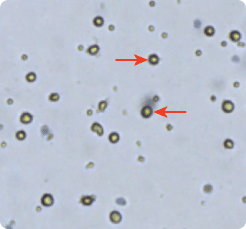
Dendritic cells (DC) were cultured from PBMCs (peripheral blood mononuclear cells) and imaged with Cellometer Auto T4. Mature dendritic cells are larger in size as seen in the micrograph and the cell size histogram. Therefore, DC cell type parameters are set to distinguish DC from smaller sized cells. Based on these parameters the Cellometer automatically determines the cell concentration of the selected population.
Mature Dendridic Cells
Cell Size Histogram
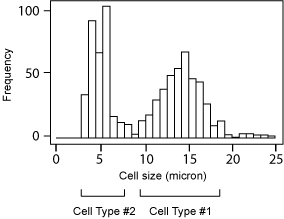
Cell Type #1: Matured DC
Concentration: 2.3 x 10⁶/ml
Mean Diameter: 13.0 µm
Cell Type #2: Small cells in PBMC
Concentration: 2.7 x 10⁶/ml
Mean Diameter: 5.9 µm
Measuring Adipocyte Cell Size
Average rat adipocyte size: 62.3 mm in diameter
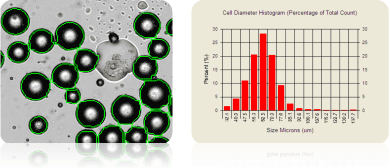
Adipocytes have been used in many studies involving obesity, metabolism, adipogenesis, and diabetes. The micrograph above shows rat adipocytes that have been counted (outlined in green) and their cell size measured. Note that the large lipid droplet in the middle of the image was not counted. To account for the adipocyte size, special PD300 slides are available and are designed for cells >80 µm in diameter. All Cellometers, excluding our 10x instruments, are compatible with the PD300 chambers.
Measuring Cell Size of Mesenchymal Stem Cells Isolated from Bone Marrow
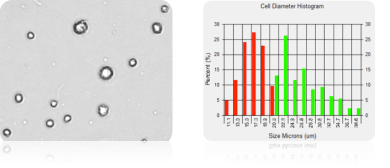
Multipotent, non-hematopoietic stem cells, such as bone marrow mesenchymal stem cells (MSC), can be isolated from human bone marrow. These non-hematopoietic, bone marrow MSCs are capable of both self-renewal and differentiation. MSC, showed above, were derived from bone marrow-mononuclear cells after the first passage. The cell size and concentration was measured using Cellometer Vision.
Measuring cell size of mesenchymal stem cells
Selected Cellometer Application Literature Review
Quantitative Approaches to Detect Donor and Passage Differences in Adipogenic Potential and Clonogenicity in Human Bone-Marrow-Derived Mesenchymal Stem Cells
Jessica Lo Surdo and Steven R Bauer
Tissue Engineering Part C: Methods
FDA/CBER/Cellular and Tissue Therapies Branch
Within a population of mesenchymal stem cells (MSCs), variability in cell properties such as proliferation, morphology, differentiation capacity, and cell surface marker expression profiles has been widely observed. Investigators are continually trying to improve cell characterization due to MSC heterogeneity. The MSCs plasticity (the ability to differentiate into many different cell types) may be due to the in vivo micro-environment, and long-term in vitro culturing. While qualitative and some quantitative approaches to assess MSCs from different donors currently exist, this paper discusses the development of robust quantitative measurements that can detect changes as a result of passaging, donor differences, and differences in subpopulations of MSCs. The overall goal of this work was to develop and employ quantitative measurements that will improve characterization MSCs by determining the role of donor variability and passage number as it relates to the biological properties and quality of MSCs
One such parameter tested was cell size. In this experiment, the cell size of MSCs was determined by diluting the cells 1:1 with trypan blue, and counting using an automated cell counter (Cellometer T4).
Mesenchymal Stem Cells were collected from two donors and the cell diameter of was measured after multiple passages. As the passage number increases, the cell diameter of MSCs from both donors increases. However, the change in cell size from the two donors was not uniform. These result shows that cell size is not only passage depended by also patient dependent.
Publications Using Cellometer for Cell Size Measurement
- Lo Surdo J, Bauer SR. (2012) Quantitative approaches to detect donor and passage differences in adipogenic potential and clonogenicity in human bone marrow-derived mesenchymal stem cells. Tissue Engineering. Part C, Methods18(11): 877-89.
- Lee JH, Kirkham JC, McCormack MC, et al. (2012) A Novel Approach to Adipocyte Analysis. Plastic and Reconstructive Surgery Journal 29(2): 380-387.
- Cecchini S, Virag T, Kotin RM. (2011) Reproducible High Yields of Recombinant Adeno-Associated Virus Produced Using Invertebrate Cells in 0.02- to 200-Liter Cultures. Human Gene Therapy 8(22): 1021–1030.
- Guercio A, Di Marco P, Casella, et al. (2012) Production of canine mesenchymal stem cells from adipose tissue and their application in dogs with chronic osteoarthritis of the humeroradial joints. Cell Biology International36(2):189-94.
- Goodman CL, Stanley D, Ringbauer JA, et al. (2012) A cell line derived from the red flour beetle Tribolium castaneum (Coleoptera: Tenebrionidae). In Vitro Cellular & Developmental Biology- Animal 48(7):426-433
- Grunow B, Noglick S, Kruse C, Gebert M. (2011) Isolation of cells from Atlantic sturgeon Acipenser oxyrinchus oxyrinchus and optimization of culture conditions. Aquatic Biology 14(1):67-75
- Norelli J. (2013) The potential role of PR-8 gene of apple fruitin the mode of action of the yeast antagonist, Candida oleophila, in postharvest biocontrol of Botrytis cinerea. Postharvest Biology and Technology 85: 203–209
- Clow AL, Gaynor PT, Oback BJ. (2010) A novel micropit device integrates automated cell positioning by dielectrophoresis and nuclear transfer by electrofusion. Biomedical Microdevices 12(5):777-86
- Chen Q, Liversidge XL, Liu B, et al. (2011) Does oxygen concentration affect shedding of trophoblastic debris or production of inflammatory mediators from first trimester human placenta? Placenta 32(5):362-6
- Pan H, O’Brien TF, Zhang P, et al. (2012) The role of tuberous sclerosis complex 1 in regulating innate immunity. Journal of Immunology188(8):3658-66
- Dmitrieva NI, Burg MB. (2007) High NaCl Promotes Cellular Senescence. Cell Cycle 6(24):3108-13
