NCI-60 Cancer Cell Lines
Introduction to NCI-60 Human Cancer Cell Lines
The late 1980s saw the development and creation of the National Cancer Institute (NCI) 60 human tumor cell line anticancer drug discovery project. This project was intended to screen thousands of pharmacological compounds for anticancer activity, thus replacing earlier cumbersome en vivo models. The 60 created cell lines represent nine human cancers: breast, central nervous system, colon, kidney, leukemia, lung, melanoma, ovary, and prostate. Since its inception, the testing of anticancer drugs using the NCI-60 panel has generated the most extensive cancer pharmacology database in the world.3 It has also provided invaluable knowledge in genome mutations, drug – tumor interactions and general tumor biology.
Nexcelom performed Cellometer image cytometry on all NCI-60 cancer cell lines. Every cell sample was individually stained with trypan blue, imaged and analyzed using the Cellometer Auto T4. Each sample was assessed for viability and cell size. The ability to accurately measure cell viability and cell size are two important components in determining the functionality of anticancer compounds. Cell death, or reduced cell size in certain tumor cell lines could be an indicator of compound efficacy.
NCI-60 Human Cancer Cell Lines
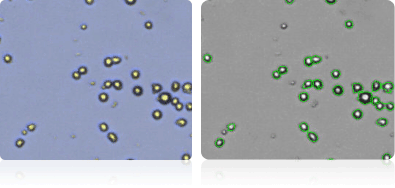
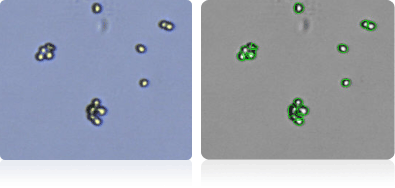
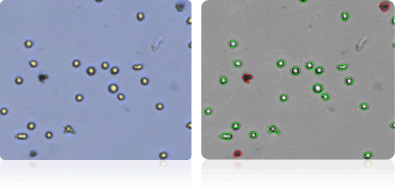
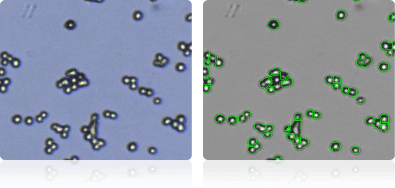
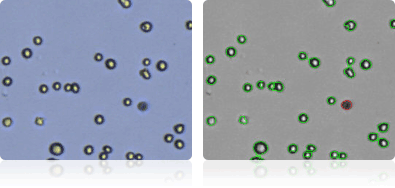
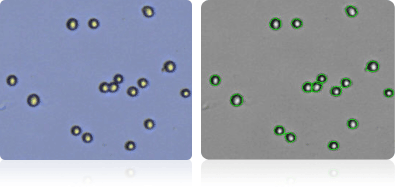
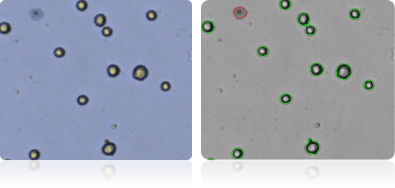
Using the Cellometer Auto T4, we imaged and counted every NCI-60 cancer cell line, obtaining the cell concentration, viability, and cell size. Shown here, are the enlarged representative images of each cell line. Since all of the cells were stained with trypan blue, we show the stained trypan blue image as well as the Cellometer counted image.
The cells are organized alphabetically by the organ or origin.
Download Excel Table: Cell size distribution for all 60 NCI cancer cell lines
NCI-60 Breast Cell Lines
Shown below are stained trypan blue images and Cellometer counted images of NCI-60 breast cell lines. Counted live cells are outlined in green while the dead trypan blue positive cells are outlined in red.
BT-549 cells
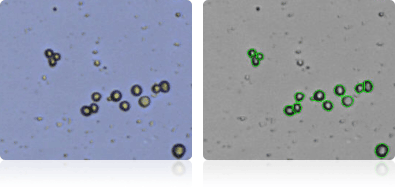
Hs 578T
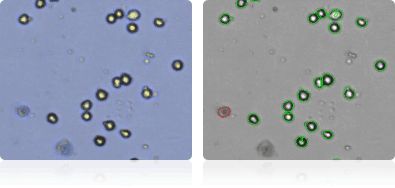
MCF7
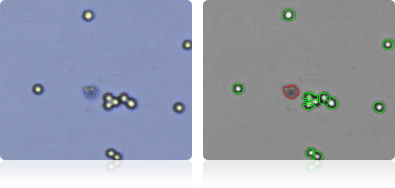
MDA-MB-231
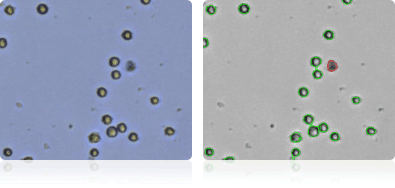
MDA-MB-468
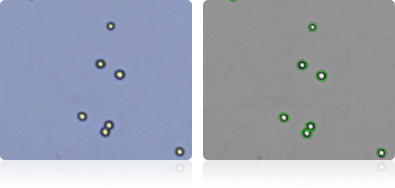
T-47D
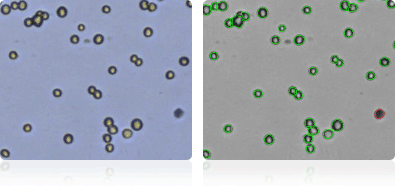
NCI-60 Central Nervous System Cell Lines
Shown below are stained trypan blue images and Cellometer counted images of NCI-60 central nervous system cell lines. Counted live cells are outlined in green while the dead trypan blue positive cells are outlined in red.
SF-268
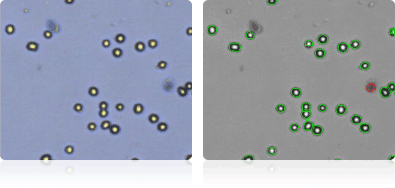
SF-295
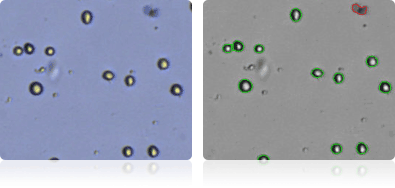
SF-539
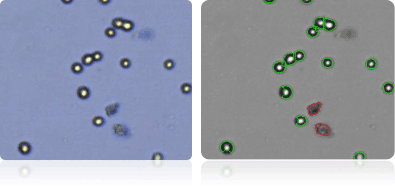
SNB-19
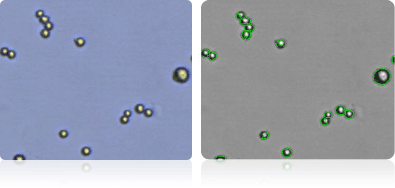
SNB-75
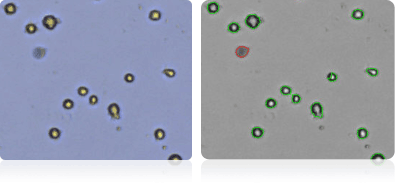
U251
NCI-60 Colon Cell Lines
Shown below are stained trypan blue images and Cellometer counted images of NCI-60 colon cell lines. Counted live cells are outlined in green while the dead trypan blue positive cells are outlined in red.
Colo205
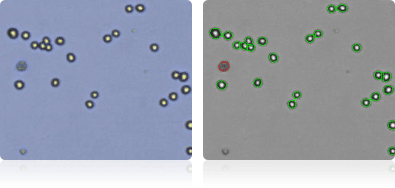
HCC-2998
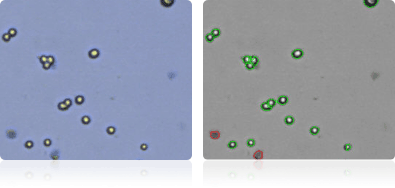
HCT-116
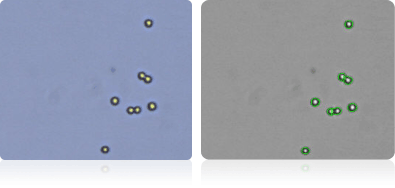
HCT-15
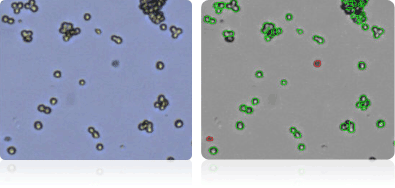
HT29
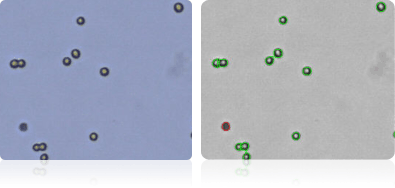
KM12
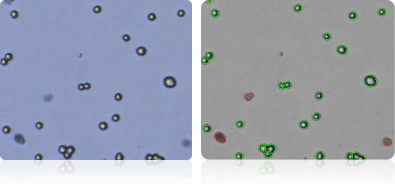
SW-620
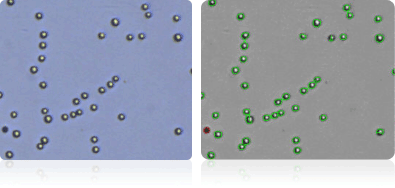
NCI-60 Kidney Cell Lines
Shown below are stained trypan blue images and Cellometer counted images of NCI-60 kidney cell lines. Counted live cells are outlined in green while the dead trypan blue positive cells are outlined in red.
786-O
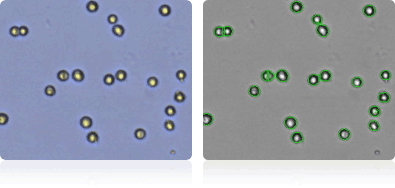
A498
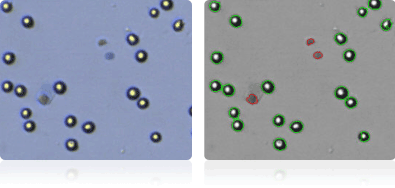
ACHN
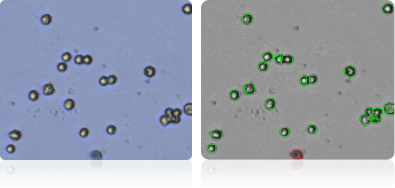
CAKI-1
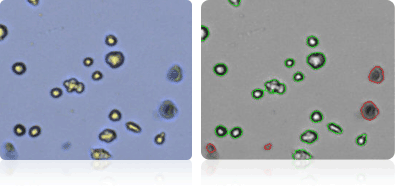
RXF 393
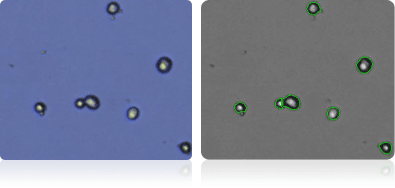
SN12C
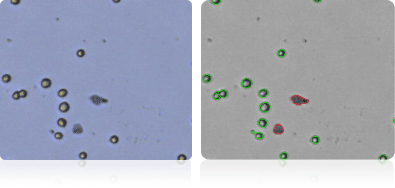
TK-10
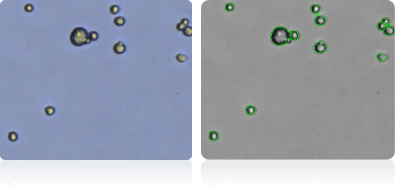
UO-31
NCI-60 Leukemia Cell Lines
Shown below are stained trypan blue images and Cellometer counted images of NCI-60 leukemia cell lines.. Counted live cells are outlined in green while the dead trypan blue positive cells are outlined in red.
CCRF-CEM
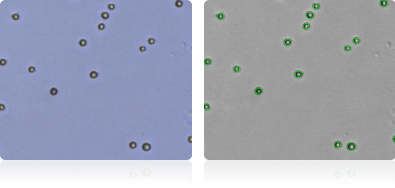
HL-60
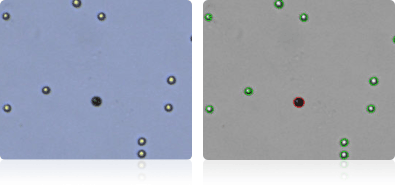
K-562
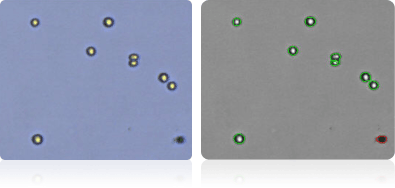
MOLT-4
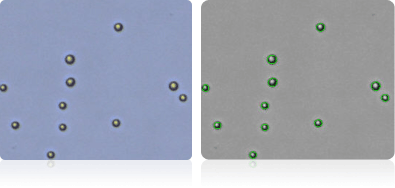
RPMI-8226
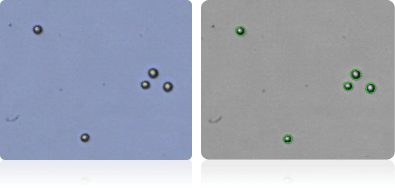
SR
NCI-60 Lung Cell Lines
Shown below are stained trypan blue images and Cellometer counted images of NCI-60 lung cell lines. Counted live cells are outlined in green while the dead trypan blue positive cells are outlined in red.
A549
EKVX
HOP-62
HOP-92
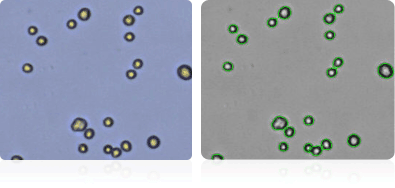
NCI-H226
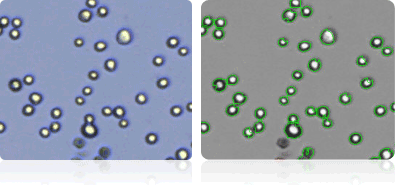
NCI-H23
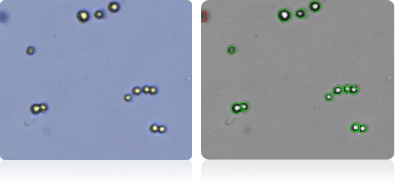
NCI-H322M
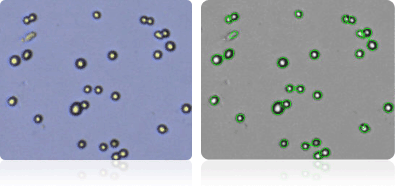
NCI-H460
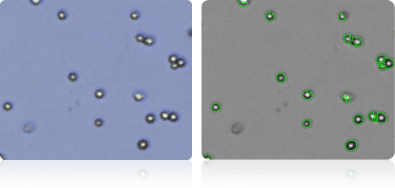
NCI-H522
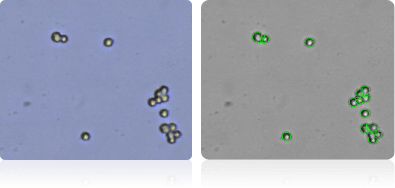
NCI-60 Melanoma Cell Lines
Shown below are stained trypan blue images and Cellometer counted images of NCI-60 melanoma cell lines. Counted live cells are outlined in green while the dead trypan blue positive cells are outlined in red.
LOX-IMVI
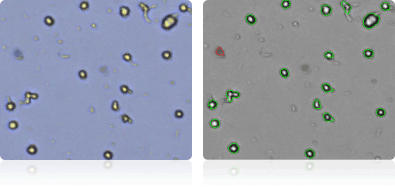
M14
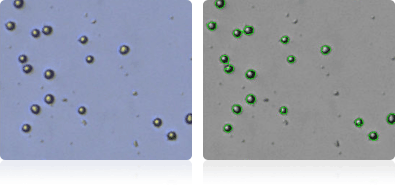
MALME-3M
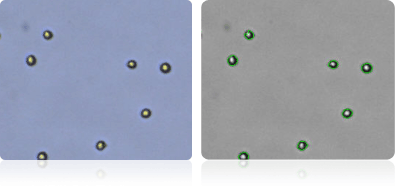
MDA-MB-435
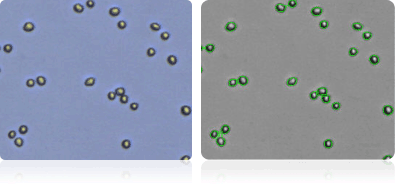
SK-MEL-2
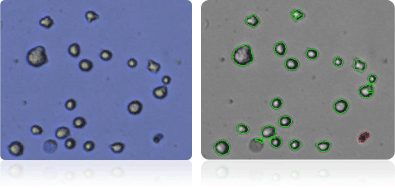
SK-MEL-28
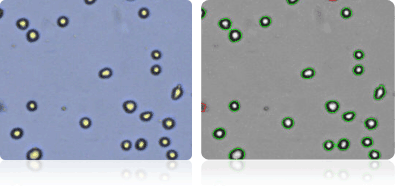
SK-MEL-5
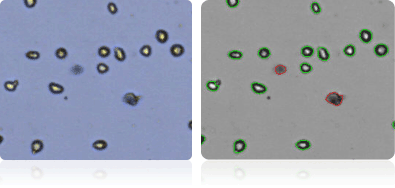
UACC-257
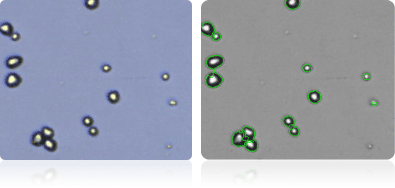
UACC-62
NCI-60 Ovarian Cell Lines
Shown below are stained trypan blue images and Cellometer counted images of NCI-60 ovarian cell lines. Counted live cells are outlined in green while the dead trypan blue positive cells are outlined in red.
IGROV1
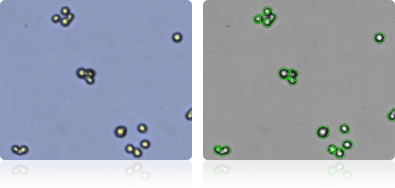
NCI/ADR-RES
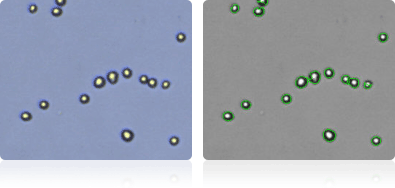
OVCAR-3
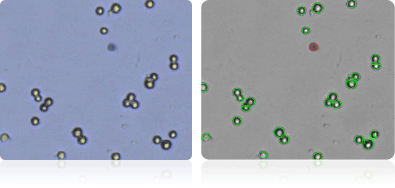
OVCAR-4
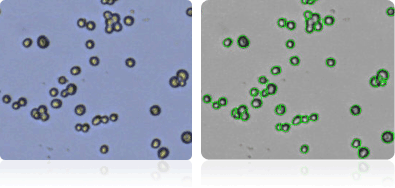
OVCAR-5
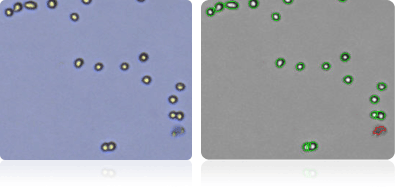
OVCAR-8
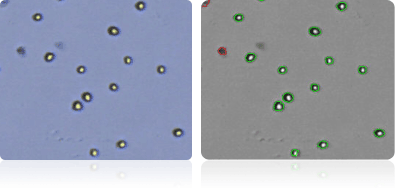
SK-OV-3
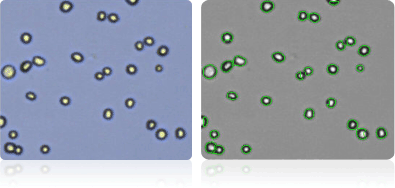
NCI-60 Prostate Cell Lines
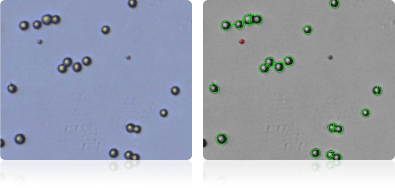
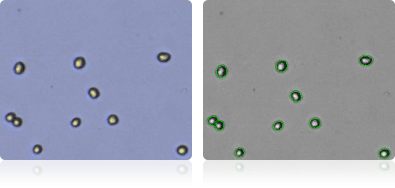
Shown below are stained trypan blue images and Cellometer counted images of NCI-60 prostate cell lines. Counted live cells are outlined in green while the dead trypan blue positive cells are outlined in red.
DU-145
PC-3
List and Description of NCI-60 Cancer Cell Lines
| Name | Species | Organ of Origin | Doubling Time (Hrs) | Disease | Culture |
|---|---|---|---|---|---|
| BT549 | Human | Breast | 53.9 | Ductal Carcinoma | Adherent |
| HS 578T | Human | Breast | 53.8 | Carcinoma | Adherent |
| MCF7 | Human | Breast | 25.4 | Adenocarcinoma | Adherent |
| MDA-MB-231 | Human | Breast | 41.9 | Adenocarcinoma | Adherent |
| MDA-MB-468 | Human | Breast | 62 | Adenocarcinoma | Adherent |
| T-47D | Human | Breast | 45.5 | Ductal Carcinoma | Adherent |
| SF268 | Human | CNS | 33.1 | Anaplastic Astrocytoma | Adherent |
| SF295 | Human | CNS | 29.5 | Glioblastoma-Multiforme | Adherent |
| SF539 | Human | CNS | 35.4 | Glioblastoma | Adherent |
| SNB-19 | Human | CNS | 34.6 | Glioblastoma | Adherent |
| SNB-75 | Human | CNS | 62.8 | Astrocytoma | Adherent |
| U251 | Human | CNS | 23.8 | Glioblastoma | Adherent |
| Colo205 | Human | Colon | 23.8 | Dukes’ type D, Colorectal adenocarcinoma |
Adherent & Suspension |
| HCC 2998 | Human | Colon | 31.5 | Carcinoma | Adherent |
| HCT-116 | Human | Colon | 17.4 | Carcinoma | Adherent |
| HCT-15 | Human | Colon | 20.6 | Dukes’ type C, Colorectal adenocarcinoma |
Adherent |
| HT29 | Human | Colon | 19.5 | Colorectal adenocarcinoma | Adherent |
| KM12 | Human | Colon | 23.7 | Adenocarcinoma, Grade III | Adherent |
| SW620 | Human | Colon | 20.4 | Adenocarcinoma | Adherent |
| 786-O | Human | Kidney | 22.4 | renal cell adenocarcinoma | Adherent |
| A498 | Human | Kidney | 66.8 | Adenocarcinoma | Adherent |
| ACHN | Human | Kidney | 27.5 | renal cell adenocarcinoma | Adherent |
| CAKI | Human | Kidney | 39 | clear cell carcinoma | Adherent |
| RXF 393 | Human | Kidney | 62.9 | Poorly Differentiated Hypernephroma |
Adherent |
| SN12C | Human | Kidney | 29.5 | Carcinoma | Adherent |
| TK-10 | Human | Kidney | 51.3 | Spindle Cell carcinoma | Adherent |
| UO-31 | Human | Kidney | 41.7 | Carcinoma | Adherent |
| CCRF-CEM | Human | Leukemia | 26.7 | acute lymphoblastic leukemia | Suspension |
| HL-60 | Human | Leukemia | 28.6 | acute promyelocytic leukemia | Suspension |
| K562 | Human | Leukemia | 19.6 | chronic myelogenous leukemia | Suspension |
| MOLT-4 | Human | Leukemia | 27.9 | acute lymphoblastic leukemia | Suspension |
| RPMI-8226 | Human | Leukemia | 33.5 | plasmacytoma, myeloma | Suspension |
| SR | Human | Leukemia | 28.7 | Large Cell, Immunoblastic | Suspension |
| A549 | Human | Lung | 22.9 | Adenocarcinoma | Adherent |
| EKVX | Human | Lung | 43.6 | Adenocarcinoma | Adherent |
| HOP-62 | Human | Lung | 39 | Adenocarcinoma | Adherent |
| HOP-92 | Human | Lung | 79.5 | Large Cell, Undifferentiated | Adherent & Suspension |
| NCI-H226 | Human | Lung | 61 | squamous cell carcinoma; mesothelioma |
Adherent |
| NCI-H23 | Human | Lung | 33.4 | adenocarcinoma; non-small cell lung cancer |
Adherent |
| NCI-H322M | Human | Lung | 35.3 | Small Cell Bronchioalveolar Carcinoma |
Suspension |
| NCI-H460 | Human | Lung | 17.8 | carcinoma; large cell lung cancer | Adherent |
| NCI-H522 | Human | Lung | 38.2 | adenocarcinoma; non-small cell lung cancer |
Adherent |
| LOX IMVI | Human | Melanoma | 20.5 | Malignant Amelanotic melanoma | Semi-Adherent |
| M14 | Human | Melanoma | 26.3 | malignant melanoma | Adherent |
| MALME-3M | Human | Melanoma | 46.2 | malignant melanoma | Adherent & Suspension |
| MDA-MB-435 | Human | Melanoma | 25.8 | Adenocarcinoma | Adherent |
| SK-MEL-2 | Human | Melanoma | 45.5 | malignant melanoma | Adherent |
| SK-MEL-28 | Human | Melanoma | 35.1 | malignant melanoma | Adherent |
| SK-MEL-5 | Human | Melanoma | 25.2 | malignant melanoma | Adherent |
| UACC-257 | Human | Melanoma | 38.5 | malignant melanoma | Adherent |
| UACC-62 | Human | Melanoma | 31.3 | malignant melanoma | Adherent |
| IGROV1 | Human | Ovary | 31 | Cystoadenocarcinoma | Adherent |
| OVCAR-3 | Human | Ovary | 34.7 | Adenocarcinoma | Adherent |
| OVCAR-4 | Human | Ovary | 41.4 | Adenocarcinoma | Adherent |
| OVCAR-5 | Human | Ovary | 48.8 | Adenocarcinoma | Adherent |
| OVCAR-8 | Human | Ovary | 26.1 | Adenocarcinoma | Adherent |
| SK-OV-3 | Human | Ovary | 48.7 | Adenocarcinoma | Adherent |
| NCI-ADR-RES | Human | Ovary | 34 | Adenocarcinoma | Adherent |
| DU145 | Human | Prostate | 32.3 | Carcinoma | Adherent |
| PC-3 | Human | Prostate | 27.1 | grade IV, adenocarcinoma | Adherent |
Compiled data from multiple sources 1, 2, 3
Download the full NCI-60 cancer cell line data list, which includes the cell size measurements of all 60 cell lines.
Conclusions
The Cellometer line of instruments is capable of measuring the cell concentration, viability, and cell size of all 60 NCI cancer cell lines. The innovative “Accurate Cell Membrane Outline Algorithm” assures that all cell samples are de-clustered and counted properly. The ability of the Cellometer instruments to accurately and consistently measure cell concentration, viability, and cell size provides researchers with a reliable tool in their cancer research.
Publications Using Cellometer Counting for NCI-60 Cancer Cell Lines
- Tedeschi PM, Markert EK, Gounder M, et al. (2013) Contribution of serine, folate and glycine metabolism to the ATP, NADPH and purine requirements of cancer cells. Cell Death & Disease 4:e877.
- Dolfi SC, Chan LL, Qiu J, et al. (2013) The metabolic demands of cancer cells are coupled to their size and protein synthesis rates. Cancer & Metabolism 1(1):20.
Additional Citations
- Jerry M. Collins, Developmental Therapeutics Program NCI/NIH. http://dtp.nci.nih.gov/
- DTP, DCTD Tumor Repository. A Catalog of in Vitro Cell Lines, Transplantable Animal and Human Tumors and Yeast. The Division of Cancer Treatment and Diagnosis (DCTD), National Cancer Institute. 2013
- Abaan OD, Polley EC, Davis SR, et al. (2013) The exomes of the NCI-60 panel: a genomic resource for cancer biology and systems pharmacology. Cancer Research.
