Embryoid Bodies & Patient Derived Organoids
Measure Size and Number of Embryoid Bodies and Patient-Derived Organoids
- Directly image tumor spheroids in various microwell formats
- Non-invasive bright field imaging allows the user to image the same plate over multiple days
- Perform a two-color fluorescence viability assay
Introduction
The Celigo imaging cytometer has been developed to fully automate live cell analysis of tumorspheres. This automated morphometric analysis tool significantly reduces the time and effort needed to quantify key aspects of 3D spheres including size, growth, growth tracking over time, and response to chemotherapeutics.

Identification and Counting of Embryoid Bodies from Spinner Flask
Experiment 1 procedure:
- One mL of cultured embryoid bodies was removed a 250 mL spinner flask and plated onto a 24 well plate
- The embryoid bodies were analyzed for number and average diameter
Whole-well image of embryoid bodies from a 24-well plate
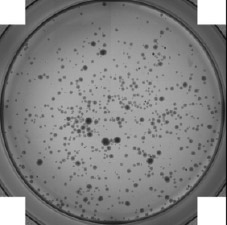
Bright field image of embryoid bodies
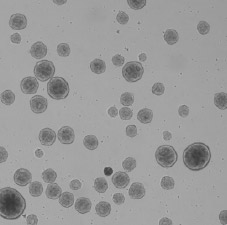
Bright field image of counted embryoid bodies
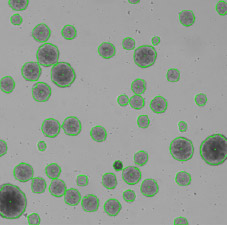
| Number of EBs | Avg. Diameter | SD Diameter | Min Diameter | Max Diameter | |
|---|---|---|---|---|---|
| Celigo | 643 | 187.1 microns | 63.9 microns | 82.5 microns | 514.6 microns |
| Manual Count | 81 | 200 microns | 61.2 microns | 99.6 microns | 434.4 microns |
The area/size of the embryoid bodies was plotted in a histogram
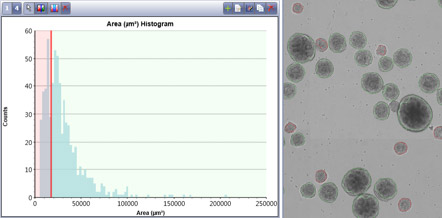
- A gate was set to show the software identification of embryoid bodies sizes.
- In this example, the red EBs have an average area of 11,577 square microns compared to the green embryoid bodies that have an average area of 38,196 square microns.
- Also, this distribution shows that most embryoid bodies fall within 10 – 50k square microns with very few very large embryoid bodies that are 100k or more.
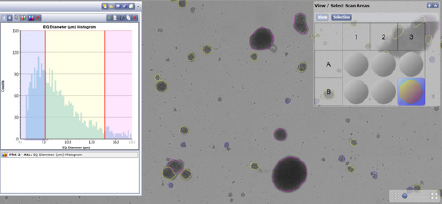
Celigo software can also plot the equivalent diameter of embryoid bodies
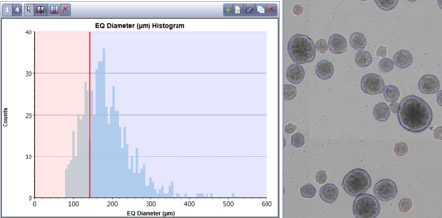
- In this example, the size gate was set at 120 microns. Therefore, all EBs circled in red have a diameter of less than 120 microns (which is 181 EBs)
- All EBs circled in blue are larger than 120 microns and are 462 in number
Experiment 2 Procedure: Identification and counting of embryoid bodies
- Whole well images from a 6-well plate were acquired and analyzed.
- Below are representative raw and analyzed images of the forming embryoid bodies.
- Green outline indicates counted stem cell aggregates.
Whole-well image of embryoid bodies from a 6-well plate
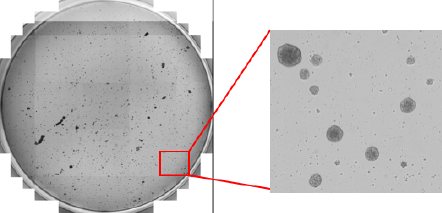
Bright field image of embryoid bodies
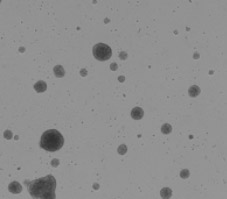
Bright field image of counted embryoid bodies
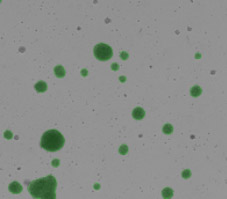
Size gating
| EBs | Number | Min size (µM) | Max size (µM) | Avg size (µM) | STDEV |
|---|---|---|---|---|---|
| Total | 3362 | 51.9 | 517.8 | 96.5 | 40.8 |
| Small | 1181 | 51.9 | 75.1 | 63.9 | 6.7 |
| Medium | 1863 | 75.0 | 149.0 | 100.47 | 19.0 |
| Large | 323 | 149.3 | 517.8 | 191.9 | 44.8 |
Table 1
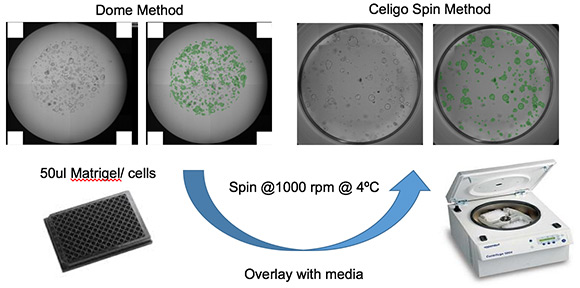
Cell Sources for Generation of Patient-Derived Organoids (PDOs)
1 Isolated adult stem/ progenitor cells

2. HESC/ iPSC differentiation

3. Isolated fragments of tissues from the corresponding organ. (e.g. intestinal crypts or liver and pancreatic ducts)
Mouse pancreatic organoids plated and imaged in 24-well plate
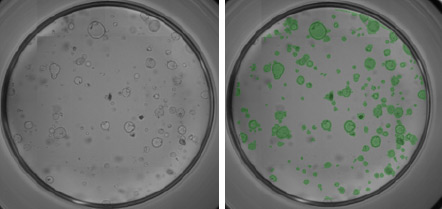
- PDO’s generated from 6000 mouse pancreatic cells seeded in Matrigel® and imaged 3-day post seeding.
- Whole well bright field images were acquired and organoid sizes automatically determined by Celigo software.
- Green fill pseudo-color is used to easily identify Celigo counted PDOs.
Mouse pancreatic organoids plated and imaged in a 96-well plate
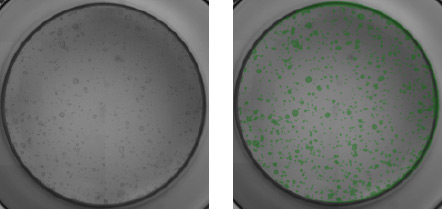
- PDO’s generated from 2000 mouse pancreatic cells seeded in Matrigel® and imaged 3-day post seeding.
- Whole well bright field images were acquired and organoid sizes automatically determined by Celigo software.
- Green fill pseudo-color is used to easily identify Celigo counted PDOs.
RFP-labeled mouse pancreatic organoids plated and imaged in a 96-well plate
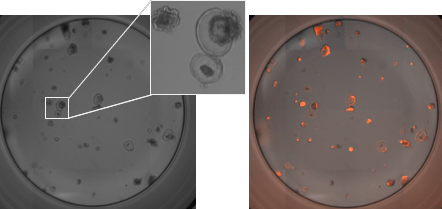
- PDO’s generated from 2000 mouse pancreatic cells seeded in Matrigel® and imaged 3-day post seeding.
- Whole well bright field images were acquired and organoid sizes automatically determined by Celigo software. The inset shows a zoomed in bright field image.
- Celigo software was used to generate the whole well RFP and bright field overlay image.
Mouse pancreatic organoids plated and imaged in a 384-well plate
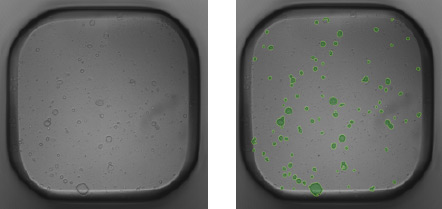
- PDO’s generated from 500 mouse pancreatic cells seeded in Matrigel® and imaged 3-day post seeding.
- Whole well bright field images were acquired and organoid sizes automatically determined by Celigo software.
- Green fill pseudo-color is used to easily identify Celigo counted PDOs.
