High-throughput neutralization assay of AAV-GFP vectors using neutralizing antibodies
In this experiment, a Celigo simultaneously imaged and quantified GFP expression after target cells were treated with different concentrations of nAbs.
- The target cells were seeded in a 96-well plate and allowed to adhere overnight
- Cells were transduced with AAV-A vector at low MOI
- Cells were pre-incubated overnight with different dilutions of nAbs and sera at 1X and 5X dilutions.
- The Celigo was then used to image and analyze the cells in brightfield and GFP fluorescence to determine transduction efficiencies
Antibody samples exerted dose-dependent neutralization effects on transduction efficiencies
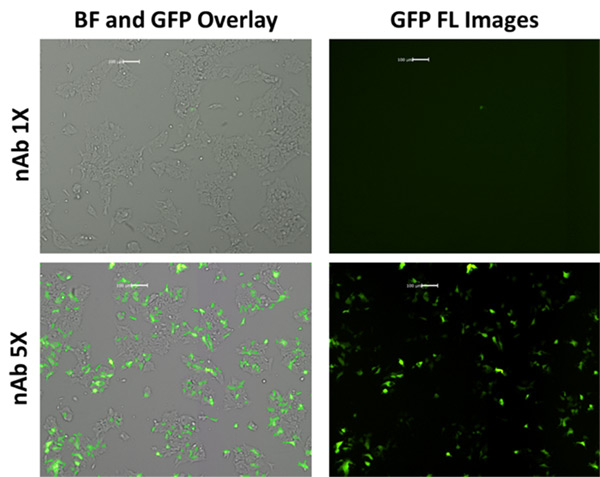
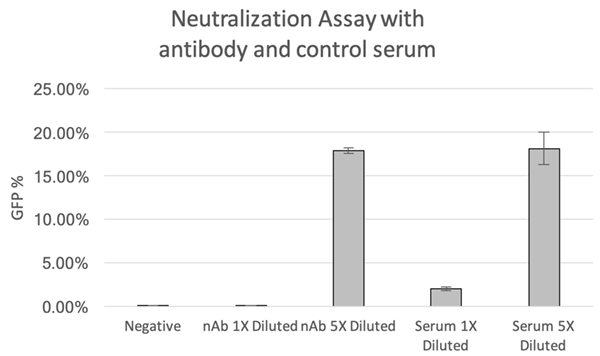
The Celigo was able to directly measure GFP+ cell percentages in the presence or absence of different concentrations of nAbs. The GFP fluorescent images and analysis results are shown in Figure 1 and Figure 2 respectively. From the GFP images, Celigo automatically segments individual cells, allowing rapid quantification of the GFP+ percentage of total cells when compared to brightfield.
- The GFP fluorescent images clearly showed that 1X diluted nAb samples dramatically reduced GFP+ percentages (<1%)
- The graph confirms that the percentage of GFP-expressing cells was significantly higher in the 5X dilution (~18% of cells)
- GFP+ percentages were comparable between the nAb and sera at both 1X and 5X dilutions

Figure 1. GFP fluorescent images for nAb treatment at 1X and 5X dilutions.

Figure 2. GFP+ percentages of target cells treated with nAb and sera at 1X and 5X dilutions demonstrating dose-dependent transduction efficiencies.
High-throughput automated neutralization assay of AAV-GFP vectors using neutralizing antibodies
Learn more:
High-throughput automated neutralization assay of AAV-GFP vectors using neutralizing antibodies
