Monitor the effect of cell wash and lysis during cell-based assay preparation
Multiple assays must be performed during experiments, and image cytometers can help researchers maximize their yield by straightforwardly visualizing differences among wells and plates following washing and cell lysis procedures.
The Celigo Imaging Cytometer was used to rapidly image whole wells in a 96-well plate using brightfield to investigate the cell wash procedure for a luciferase assay. The brightfield images were simultaneously analyzed to automatically quantify the confluence percentage in each well.
- Target cells are seeded per well
- The plate is incubated overnight for cell adherence
- The cells are transfected with a luciferase reporter plasmid
- Cells are then washed and immediately imaged by the Celigo
- Finally, the cells are lysed for the luciferase assay readout, and immediately imaged by the Celigo
The cell wash step can remove adherent cells in the well
Researchers who perform in-plate assays usually remove the media and wash the wells before adding reagents. Zoomed-in brightfield images show the same well before and after the plate is washed (Figure 1a). The whole-well and insets show substantial cell loss, which the software automatically calculated as approximately 20% (Figure 1b).
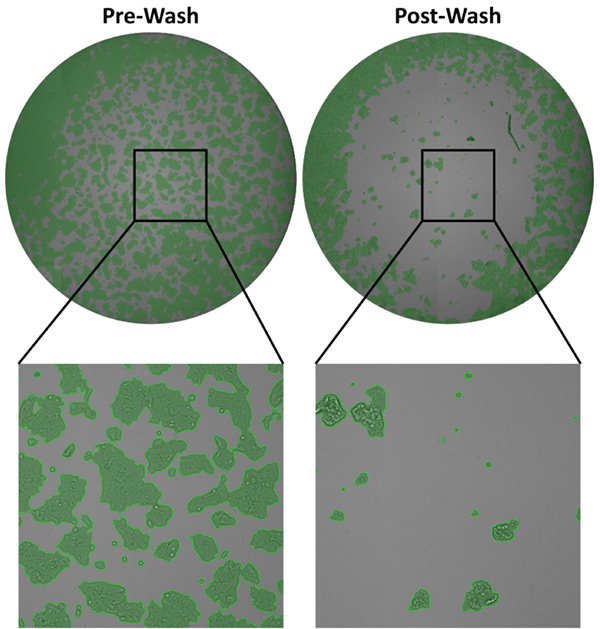
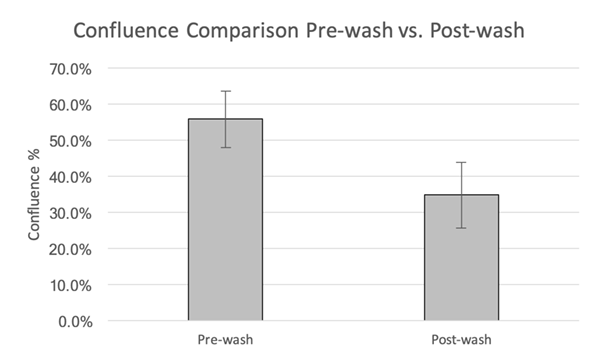
Figure 1. (a) Zoomed-in, whole-well brightfield images for both pre- and post-wash cells in the same well with pseudo-color green fill indicating cell confluence area. The well showed a noticeable area where the cells are washed off. (b) Cell confluence measurement compared between pre-wash and post-wash, showing an approximate 20% decrease of cells.
The lysing step requires optimization to ensure lysis of every cell
In the second example, the plate contained cells that had been transfected with a luciferase reporter plasmid (Figure 2a). The media was removed, the plates were washed, and the cells were lysed directly in their wells for one hour. Images were taken before and after washing and then again after cell lysing. The confluences were 63.4%, 54.7%, and 32.8%, respectively (Figure 2b).
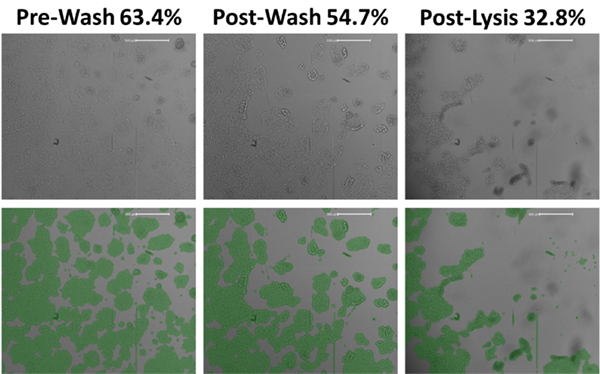
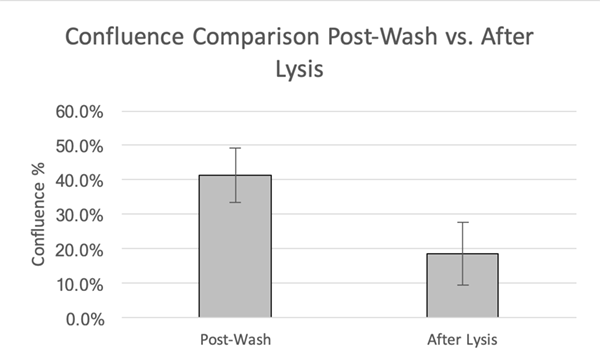
Figure 2. (a) Zoomed-in brightfield images for pre-wash, post-wash, and post-lysis cell samples in the same well with pseudo-color green fill indicating cell confluence area. The well showed a noticeable area where the cells washed off however, some cells remained after lysing. (b) Cell confluence measurements comparing post-wash and post-lysis images show more than a 20% decrease in cells.
These examples emphasize how image cytometry enables researchers to account for well-to-well differences while performing assays, minimize experimental variability, and make data-based decisions during experiments.
Learn more:
Monitor the effect of cell wash and lysis during cell-based assay preparation
Learn more:
Monitor the effect of cell wash and lysis during cell-based assay preparation
