| Purpose | Image and count the number of cells which have migrated through the membrane of a transwell insert using fluorescent detection of DAPI-stained cells. |
| Existing Method(s) | Manual visualization using standard light microscope |
| Target Cell Type | Three different cancer cell lines (undisclosed) |
| Experiment Plan | Scan plate using Bright field and Blue channels |
| Hypothesis | We will be able to stain and count the number of cells which have migrated through the membrane of a transwell insert. |
Celigo Setup
| Plate Type | Transwell inserts placed in a 24-well BD Falcon 353047 plate |
| Scan Channels | Bright field and Blue channels |
| Resolution | 1 µm/pixel |
| Scan Area | Partial Well – 25 FOV |
| Analysis Method | Target 1 + 2 |
| Scan Frequency | End Point |
| Scan Time | 3 minutes |
Assay Protocol and Plate Setup
Protocol:
- Three different cancer cell lines were seeded into a transwell insert and grown according to the customer’s standard procedure, with or without treatment to stimulate migration.
- 24hrs after seeding, the transwell inserts were removed and the cells were fixed in the transwell insert with formaldehyde for 10 minutes.
- Cells were then washed with water to remove the formaldehyde.
- Using a sterile cotton swap, cells which had not migrated through the membrane were scraped off the top of the transwell insert.
- A staining solution of DAPI, with a permeability reagent, Triton X-100, was prepared in 5 mL PBS.
- 1:1,000 dilution of DAPI stock (10mg/mL) for a final 10 µg/mL
- Nexcelom, Cat# CS1-0127
- Add Triton X-100 for a final 1% solution
- 1:1,000 dilution of DAPI stock (10mg/mL) for a final 10 µg/mL
- 600 µL of staining solution was added to a clean well of a 24-well BD Falcon plate (Cat# 353047).
- Placed transwell insert into a well with staining solution and allowed to stain for approximately 10-15 minutes.
- Removed transwell insert and washed with PBS to remove any stain or Triton X-100.
- Added 600 µL of PBS to a clean well of a 24-well BD Falcon plate.
- Placed washed transwell insert into the well.
- Imaged on Celigo using the Target 1 + 2 application with Bright field and Blue channels.
Data Analysis
- The organoids were counted using Celigo application Tumorsphere 1
- The IDC organoids counts were generated, as well as the size of the organoids
Results
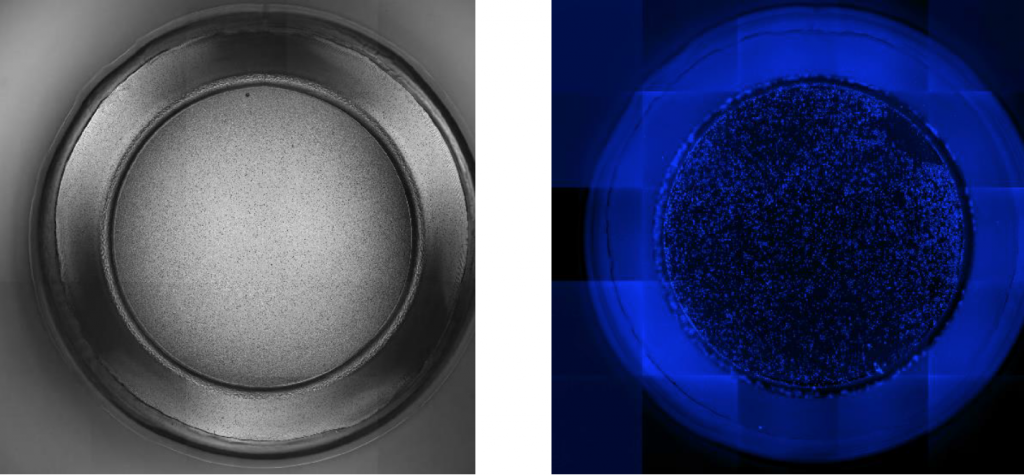
1. Bright field and Blue image of well A1
Full insert images / partial well images (25 FOV)
Zoomed-in images
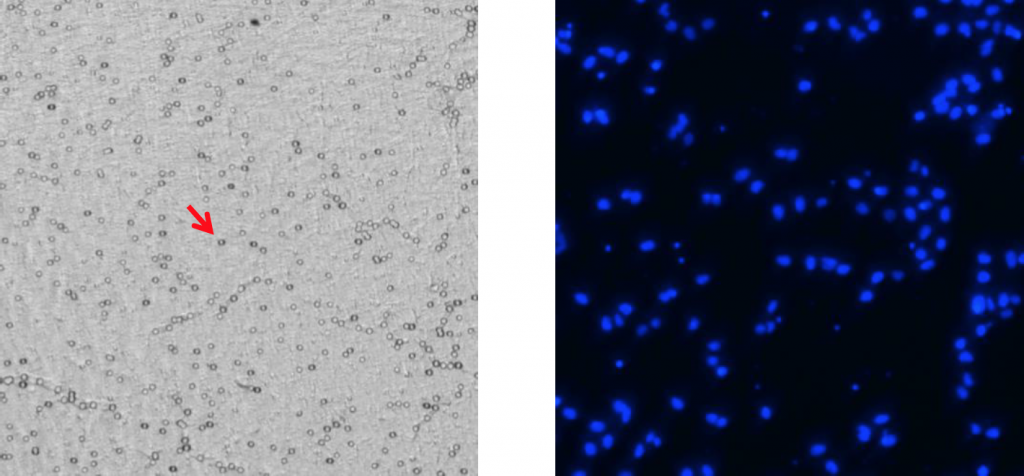
Note: The circular objects seen in the Bright field images are the pores in the transwell membrane. The red arrow points to one of the many pores that can be seen in the image.
Overlay of Bright field and Blue images
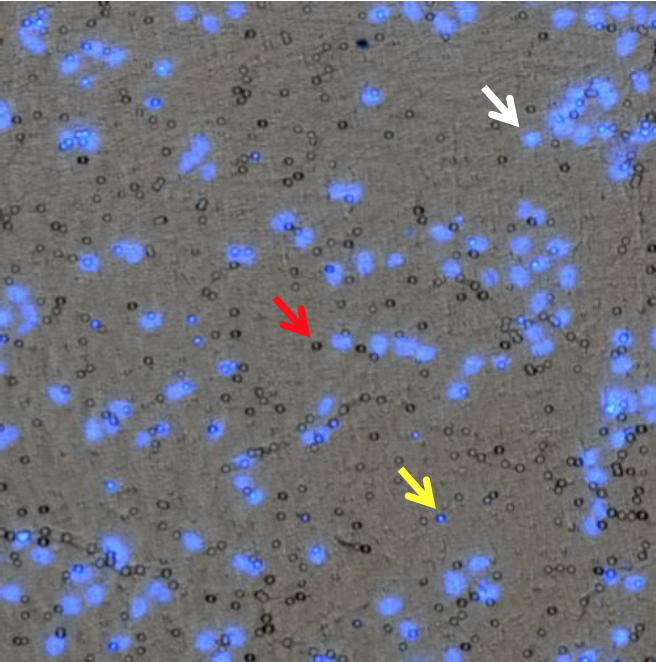
Note: The overlay of the bright field image with the DAPI image allows the confirmation that the circular objects seen in the bright field image are the pores in the membrane, and not cells (see red arrow). The cells are stained with DAPI and appear as the blue dots in the image (see white arrow). Some cells are still migrating through the pores, thus the blue dots occasionally line up with some of the pores in the image (see yellow arrow).
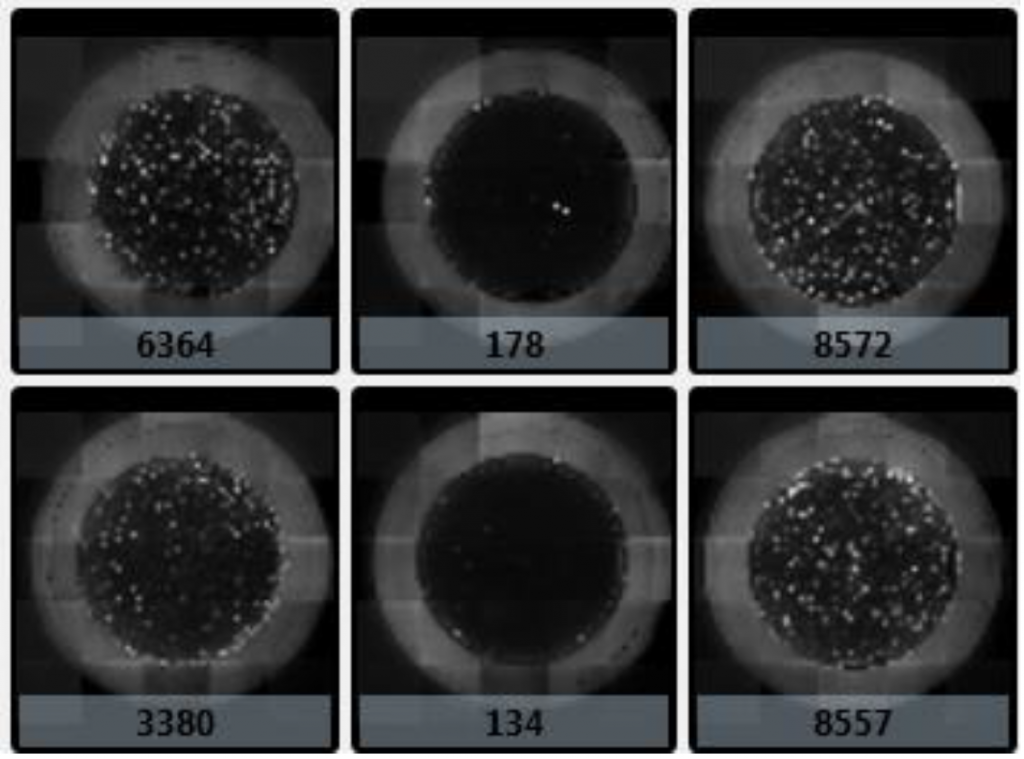
2. Numerical counts of DAPI-positive cells
Conclusion
- The Celigo successfully imaged and counted the number of DAPI-positive stained cells which had migrated through a membrane in a transwell insert.
- Acquisition of high-resolution DAPI and bright field images of the transwell membrane surface in a 24 well plate format took ~ 3 minutes.