Zika virus microneutralization assay using different antibodies measured by direct cell counting in 96-well plate
- Raji cells and 6 different antibody-RVP complexes (GFP-expressing Zika virus) are infected and seeded in 96-well microplates following the protocol described above
- After 48 hours, the Celigo image cytometer was used to count the number of GFP positive infected cells in each well to generate a dose response curve for all tested antibody-RVP complexes
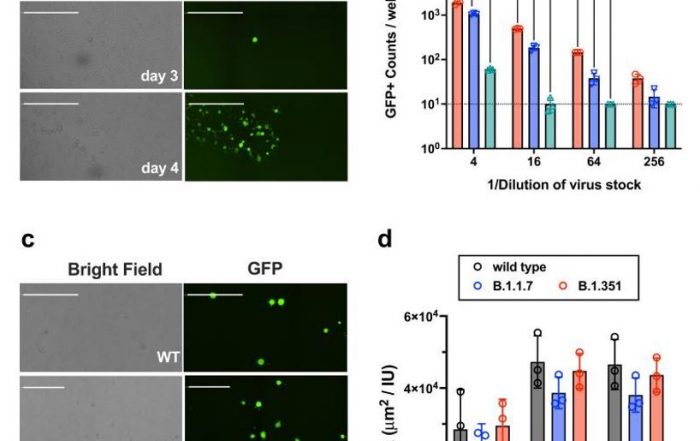
- Two sets of example images of antibody-RVP complexes treatment are shown below, where GFP positive infected cells can be observed at different antibody concentrations

Antibody dose-dependent bright field and GFP overlay images of Zika infected cells
- After counting the number of infected cells and total cell count for each antibody-RVP complex and concentrations using the gating function in Celigo, a dose-response plot of % infection is generated and IC50 values are calculated.


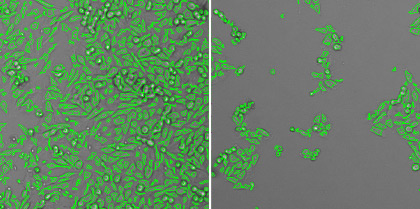
GFP fluorescent intensity histogram for gating infected cell population
Directly outline and count non-infected and infected cell populations after gating

Directly outline and count non-infected and infected cell populations after gating
- The dose-dependent antibody neutralization IC50 results are directly compared to FACS and are highly comparable

Comparison of percent Zika virus infection corresponding to various antibody titrations between Celigo and flow cytometer
The Celigo Image Cytometer automates antibody neutralization assays:
Zika virus microneutralization assay
The Celigo Image Cytometry system performs high-througput, whole-well imaging and quantitative data in bright field and up to four fluorescent channels for a wide variety of cell-based assays.
Learn more about modern virology assays: