The tech-transfer case of Janet and James
Janet was a careful scientist in a bioprocess R&D lab. She performed several experiments to determine precise quantities of each reagent to add to her cell culture as a function of viable cell density. She was right to be careful. Her protocol would be transferred to another laboratory across the country, and its yield was sensitive to cell density. Finally, with data collected and results reported, she was ready to send her final protocol to James, a scientist at the other site.
To their dismay, James was unable to obtain the high yields Janet had achieved. Weeks of repeated experiments followed. Several times, Janet overnighted fresh cells to James, as well as carefully prepared aliquots of her reagents. They reviewed the protocol together step-by-step, matching even the models of the equipment at the two sites. Reproducibility still eluded them. What more could they have done?
Moving from repeatability to reproducibility
This scenario illustrates what can happen when instruments disagree, and the problem is particularly difficult in the case of automated cell counters. For many other types of measurement, close agreement between instruments is achieved by calibration to a reference standard. Some examples include the calibration of a group of analytical balances to a single reference mass and calibration of pH meters to a precisely prepared buffer solution. A useful reference standard is both stable and homogeneous – two words that describe exactly what a live cell suspension is not! Live biological samples are dynamic and heterogeneous, making calibration of a cell counter to a single live-cell reference standard a major challenge. Because the accuracy of cell counting methods can’t be determined by comparison to a reliable standard, methods are often compared with each other only based on precision, expressed as a coefficient of variation (CV), the standard deviation of multiple measurements divided by their average.
Levels of Precision: Repeatability, Intermediate Precision, and Reproducibility
It is relatively easy to measure the repeatability of a cell counting method by collecting many measurements of the same cell sample under the same conditions and within a short time. But reproducibility, the agreement of measurements taken of the same material in completely different laboratories, is much more difficult to estimate and improve. Figure 1 illustrates the gap between these two extremes, known as intermediate precision.
Intermediate precision reflects the variability found within the same lab from day to day, operator to operator, lot to lot, or instrument to instrument. For a cell counting method to give reproducible results across laboratories, it must also show good repeatability and good intermediate precision. The ability of multiple instruments of the same model to give consistent results is a critical component of intermediate precision and consequently reproducibility.
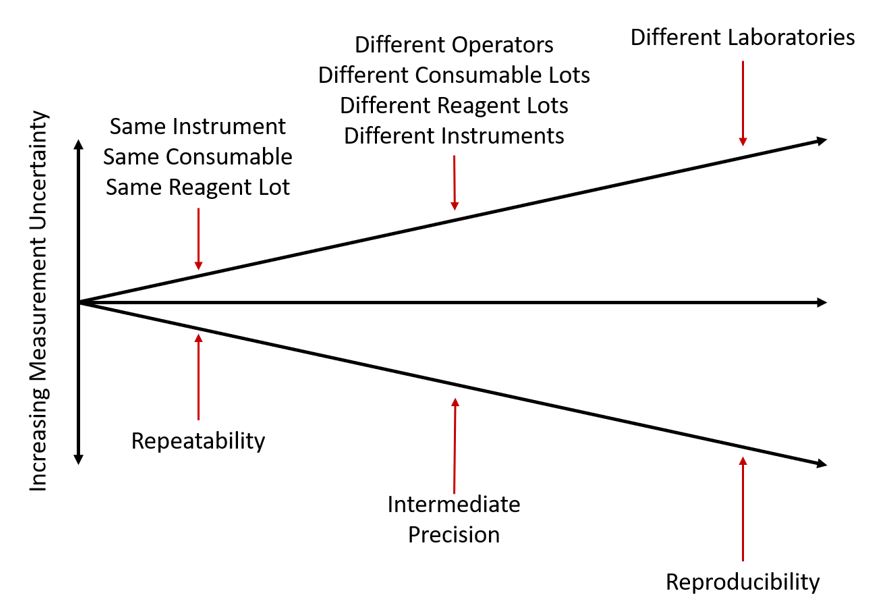
Figure 1: Illustration of levels of precision. The least variation is usually found among measurements taken under conditions of repeatability – measuring the same sample repeatedly under the same conditions. The inclusion of multiple instruments, operators, or material lots causes additional variation, creating conditions of intermediate precision. Finally, measurements taken of the same or similar sample in completely different laboratories usually include all of the previously mentioned sources of variability, and result in the largest CVs. Precision under these conditions is referred to as reproducibility. (Adapted from V J Barwick and E Prichard (Eds), Eurachem Guide: Terminology in Analytical Measurement – Introduction to VIM 3 (2011). ISBN 978-0-948926-29-7)
Why instrument-to-instrument variation may not be detected until it’s too late
Because good intermediate precision is a prerequisite for good reproducibility, it is important to understand and account for instrument-to-instrument variation. There is a key reason why instrument-to-instrument variation can go undetected and unaddressed: when only a single cell-counting method is used, a bioprocess can often still be successfully developed, even if the cell count is flat-out wrong.
This comes down to a fundamental truth about most assays that involve cell concentration: proportionality matters more than absolute cell count. As long as the cell counter returns a number that is proportional to the cell count, the assay can succeed.
As a simple example, suppose that two cell counting methods use different reagent formulations. For Method A, a cell suspension is diluted 1:2 with Reagent A. Method B requires a 1:5 dilution with Reagent B. These different dilutions result in different proportionality constants for the two methods. Once the cells are counted in the dilutions, however, the difference in concentration can be easily corrected to obtain the original cell concentration because the difference in proportionality between the two methods is known. A bioprocess could be developed and optimized using either method without issue.
The problems show up when there are differences in the proportionality constants of two instruments that are not known. Just as in the previous case, the bioprocess can be optimized, but without knowing what the bias between the two instruments is, we can’t easily translate from one to the other. Any error in the cell count that is proportional to the count itself is a potential source of such a hidden bias. Let’s look at a couple of examples.
Example 1: Conversion from cell count to cell concentration
The first example involves an error in the estimation of volume. To calculate a cell concentration, the number of counted cells is divided by the volume of suspension in which the cells are found. Automated cell counters use estimates of their analyzed volume to report concentration. If the volume estimate is too low by 50%, the concentration result will be too high by 50%, regardless of the cell concentration. The reported values for cell concentration are wrong, but they are still proportional to the correct concentration, and the assay could be successfully tuned to the incorrect counting method.
Example 2: Counting debris with the cells
The second example relates to the specificity of a cell counting method – counting only the objects that should be counted. Suppose that some cellular debris is being counted along with the cells of interest, such that the number of counted objects is 20% too high. If we now dilute the sample, both the cells and the debris will be diluted by the same amount, and the count will still be 20% too high. This lack of specificity affects the cell count, but it doesn’t affect its proportionality. The assay can still be optimized using this cell counting method, but switching to a different method is likely to lead to sub-optimal results.
A course of action
A protocol may work perfectly well, as long as the method of cell counting remains unchanged. The experiments may be highly repeatable, and results may even have some degree of intermediate precision for certain changes in reagents or operators, but if the instrument-to-instrument variation is large, there’s little hope of reproducibility between laboratory sites or when a new cell counting method is implemented. So, what can be done? How can we know whether our chosen cell counting method is future-proof?
Ideally, if a new protocol is intended to be run using “Cell Counter A”, several “Cell Counter A” instruments would be used from the early stages of protocol development to estimate and improve reproducibility, but this is often not feasible. Some of the same benefits of such a study may be obtained by taking parallel measurements using any available orthogonal cell counting method(s).
While it does not provide a complete picture, comparison among different methods can give a sense of the uncertainty in a cell counting method. Manual counting with a glass hemocytometer is often the least expensive option for comparison. Dedicated experiments in which one or more samples are measured using multiple instruments are also useful, even if the cell type is not the same. Microbeads can even be used, which are usually more stable than biological samples, providing more time to complete the comparison experiment. In the following section, we share the results of some of the experiments we’ve performed to investigate how much one cell counter may differ from another of the same model.
Estimating instrument-to-instrument variation from experimental data
How much will two cell counters disagree? It might make sense that there would be some variation between a manual hemocytometer method and a completely different approach, such as using a Coulter counter. But large differences have also been found among instruments of the same model from the same supplier. Take a look at Figure 2, which shows the counting results from two automated carousel-style cell counters of the same type for ten different CHO cell samples. Even under these ideal conditions, with two “identical” instruments operated by a competent 3rd party, the differences for the same cell sample can be as high as 23.6%. The instrument-to-instrument CV for these instruments and samples is 9.2%, even though the measurements from each instrument individually were quite repeatable, with a count-to-count CV of 4.0%. Results like these demonstrate one reason scientists and lab technicians often stick with a favorite instrument, shunning other cell counters in the lab.
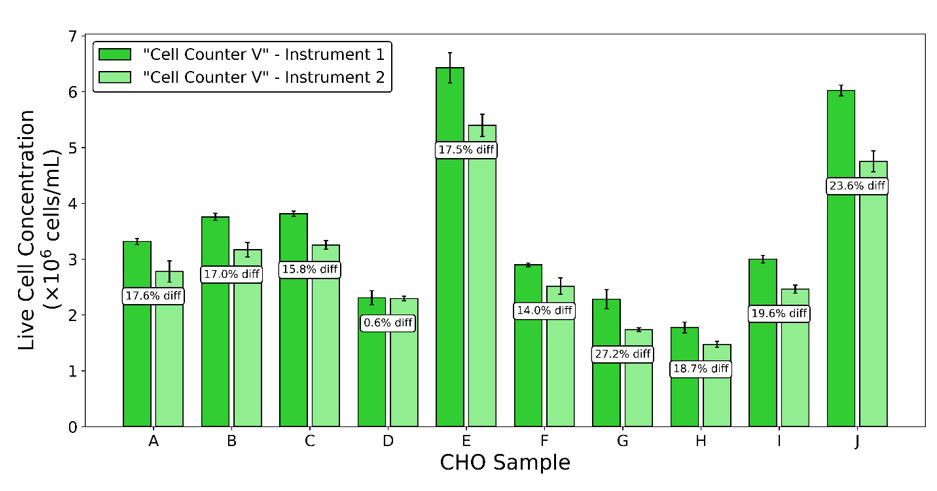
Figure 2: Two carousel-style automated cell counters of the same model were used to measure 10 healthy CHO cell samples. Three (3) replicate measurements were made with each cell counter for each sample.

While instrument-to-instrument variation can never be completely removed, Nexcelom cell counting products excel at consistency. Figure 3 presents the results of an experiment performed using five Cellaca MX instruments to count the same Trypan blue-stained sample of CHO cells. Multiple chambers and counting plates were used so that those sources of variation would be represented as well. The results show the five instruments counted very consistently, with an inter-instrument CV of 2.0% and a repeatability of 5.7%.
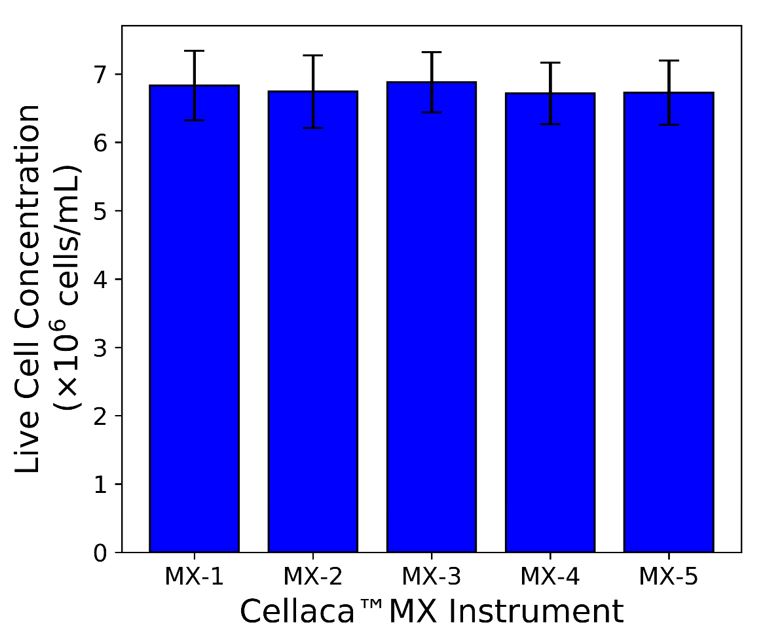
Figure 3: Five Cellaca MX instruments were used to measure a single CHO sample mixed with Trypan blue. Twenty (20) measurements were made of each sample, evenly divided between 2 counting plates.

Unfortunately, experiments such as this provide limited information. Calculations of CV are less accurate when only a few examples are included. To get better instrument variability data, we would want a very large pool of instruments to compare with each other. But high-end automated cell counters represent a significant investment, and to round up and occupy a large number of instruments is not a simple task. In addition, the time required to perform such an experiment can lead to changes in sample composition, especially with slower cell counters.
Beads are often used to mimic cells in instrument evaluation, but bead suspensions are susceptible to settling, clumping, and evaporation. To create stable reference samples that can be used on many more instruments over much longer periods, we developed a process to encase microbeads in a clear resin. Once cured, the beads stay locked in the resin indefinitely. There is no evaporation or significant degradation of the sample for many weeks at a minimum.
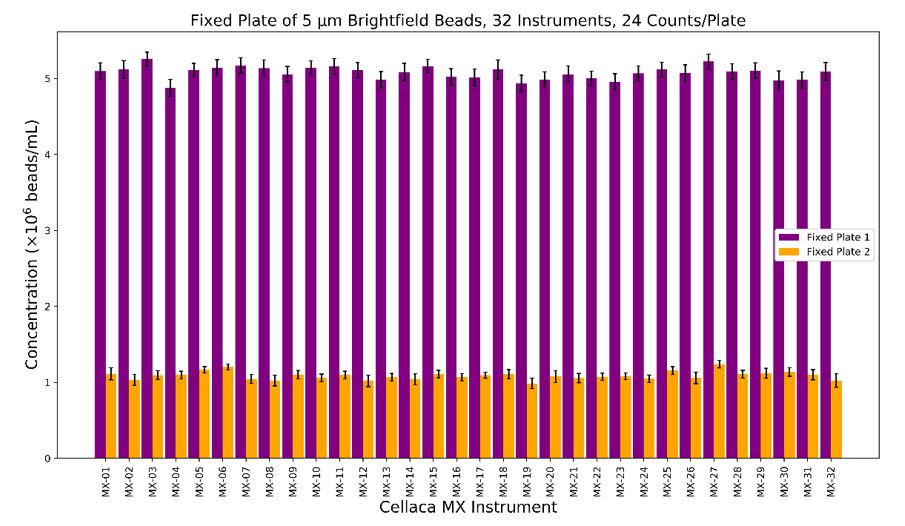
Figure 4: Cured bead samples allow for comparison of much larger groups of instruments over long periods of time. Beads were prepared in two concentrations (indicated by 2 colors) and used each concentration to fill 2 Cellaca counting plates. The plates were then analyzed with 32 Cellaca MX instruments with 48 counts per concentration per instrument.

Our samples included 5 μm beads at two concentrations of approximately 1 million and 5 million beads/mL. We counted these cured samples on 32 Cellaca MX instruments over the course of a year of production. The same brightfield assay settings were used on each instrument and were not adjusted to bring the counts closer together. With all instruments represented, we observed an instrument-to-instrument CV of 4.9% for the lower concentration and 1.6% for the higher concentration (Figure 4). While these results represent just one of the assays the instrument can perform, having data from so many instruments strengthens confidence in the consistency of the Cellaca MX.
Summary
The goal of highly reproducible assays is undeniably ambitious. Good reproducibility in the measurement of cell concentration and viability relies on having well-controlled steps throughout the entire cell counting process. It is important to realize that any change to any step in the entire process of a cell counting method will result in counts that are at least slightly different when compared over many samples. Differences between instruments, even of the same model, can cause significant bias in cell counting results. Treating the measurement results of one method or instrument as absolute truth can lead to hidden biases, whose effects become apparent only when the assay is attempted with or validated against a new method. Choosing a cell counting instrument with high instrument-to-instrument consistency can help mitigate this risk. While picking the right cell counting method won’t guarantee an assay’s success, picking the wrong one may set it up for failure.
Other factors that can affect the selection of cell counting methods and the quality of cell counting measurements can be found in the Practical Cell Counting Method Selection to Increase the Quality of Cell Counting Results Based on ISO Cell Counting Standards Part I.
For a full description of the experiments highlighted here and more, see the paper in Cell and Gene Therapy Insights.



Leave A Comment