Rapid Quantification of Pathogenic Fungi by Cellometer Image-Based Cytometry
Joint collaboration between Nexcelom Bioscience and Merrimack College
Objective: To demonstrate a simple image cytometry method for the quantification of viable pathogenic fungi, Histoplasma capsulatum. To validate image cytometry as a viable alternative method to CFU counting, a method that is time-consuming (sometimes taking 1-2 weeks for the formation of visible colonies), labor-intensive, and limited in efficiency and sensitivity. To validate image cytometry as a viable alternate to flow cytometry, due to the high cost, complexity, and biosafety containment issues associated with the use of flow cytometry for analysis of pathogenic fungi.
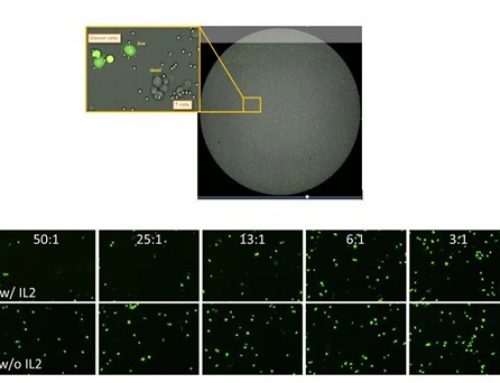
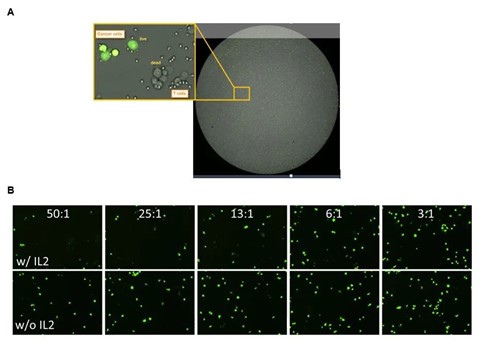
Experiment: 1. A time-course study was conducted to measure infection of RAW 264.7 macrophages with the pathogenic yeast H. capsulatum with and without uracil supplementation. AO/PI (acridine orange / propidium iodide) concentration and viability measurements using the Cellometer Vision were compared to CFU. 2. A dose response study was conducted to measure the dose response effect of amphotericin B and itraconazole on H. capsulatum yeast. AO/PI and CFU methods were compared at 24 hours. 3. Bone marrow-derived macrophage (BMDM) infection with GFP expressing-C. albicans yeast was measured using GFP analysis on the Cellometer Vision CBA Image Cytometry System.
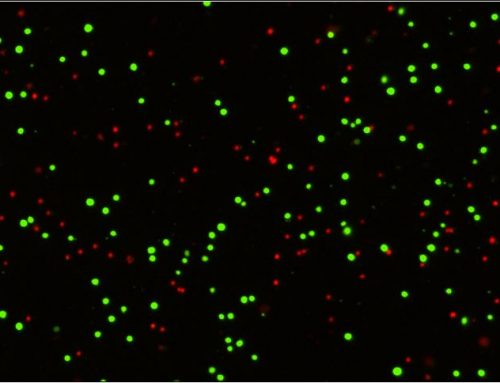
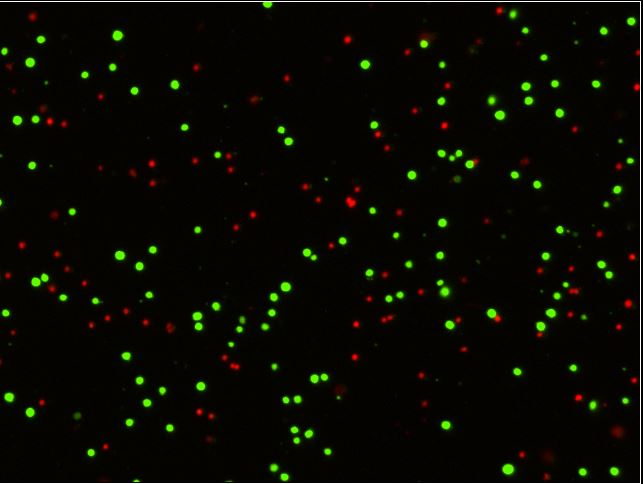
Image Cytometry Procedure: To analyze concentration and viability of pathogenic yeast, the RAW 264.7 macrophage were lysed with sterile water to release yeast cells and diluted 1:1 with an AO/PI staining solution. Using green fluorescence to identify AO-stained live nucleated cells, and red fluorescence to identify PI-stained dead (non-viable) nucleated cells, the concentration and percentage of live and dead yeast cells was easily calculated for each sample analyzed. For GFP-expressing infected BMDM, 20 µl of cell sample was added to a Cellometer Counting Chamber. Bright field imaging was used to count total cells and green fluorescence was detected for identification of GFP-expressing infected cells. The concentration and percentage of cells in each sample expressing GFP was easily calculated and displayed as a histogram using FCS Express software.

Imaging of Pathogenic Yeast with Cellometer Vision 10x
Results: 1. Withdrawal of uracil from cultures resulted in a drop in yeast viability from ~90% to ~65%. Comparable trends were observed between AO/PI results and CFU counts. AO/PI results were consistently higher due to plating efficiencies; the presence of viable, but non-cultivatable cells; and the limited sensitivity of CFU counting. 2. Analysis of percent viability over a range of amphotericin B and itraconazole concentrations showed a rapid decline in viability with IC50 values of 0.17 ug/mL (amphotericin B) and 2.61 ug/mL (itraconazole). At amphotericin B concentrations ³ 0.25 ug/mL, no CFU formed, though AO/PI analysis detected viable yeasts. 3. For the infected BMDM, multiplicities of infection (MOI) raging from 0.1 to 10 correlated to incremental increases in GFP intensity within infected macrophages and the percentage of infected macrophages in the sample.
Conclusion: The Cellometer Vision CBA Image Cytometry System and Cellometer AO/PI Viability Reagent provide a simple, fast, accurate method for the measurement of pathogenic yeast. The Cellometer AO/PI method can be used in place of colony counting and flow cytometry for determination of concentration and viability of pathogenic yeast. The Cellometer Vision and AO/PI analysis method are valuable tools in the field of fungal pathogenesis.
For additional details and experimental results, please see the full publication: Berkes, C.A., et al. (2012). Rapid Quantification of Pathogenic Fungi by Cellometer Image-Based Cytometry, J. Microbiol. Methods, http://dx.doi.org/10.1016/j.mimet.2012.09.008.
Leave A Comment