Improving the T-Cell Killing Assay
Harnessing the ability of T cells to recognize and kill malignant cells shows great promise in the clinical arena and immunotherapy for cancer treatment remains an area of active investigation. The Celigo Image Cytometer has been previously used for a wide range of immuno-oncology and immunotherapy studies, demonstrating the great utility of this instrument to assess the activity of cytotoxic immune cells against malignant cells of interest.
In the present study, scientists at the University of Michigan sought to improve the current imaging cytometry workflow by using a Nur77-GFP reporter system. The researchers provide data that shows that this platform directly measures both T-cell activation and their capacity to specifically target and eliminate MC38 cancer cells. Furthermore, the study also evaluated this reporter system on its ability to assess the effects of a small-molecule inhibitor on both T-cell activation and the functional response of MC38 cancer cells. The results of this work demonstrate the effectiveness of the Nur77-GFP reporter system and imaging cytometry to investigate the effects of different treatment conditions on the T-cell cytotoxic response.
Establishing the Model
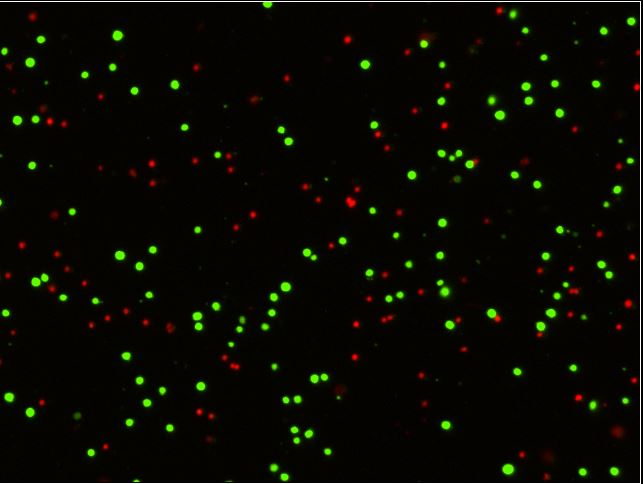
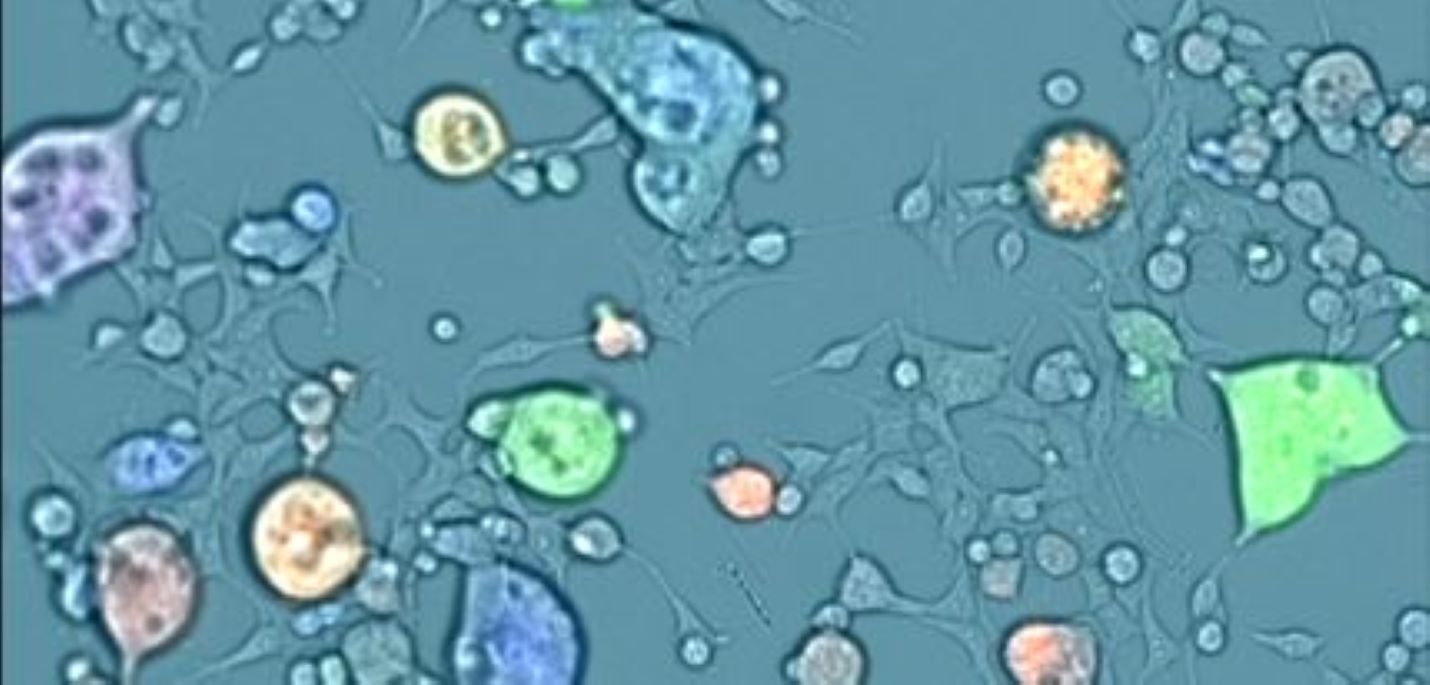
The basic cytotoxicity assay workflow on Celigo has been previously described. Briefly, target cancer cells are labeled with dyes such as calcein AM to easily track their number over time, then these cancer cells are co-incubated with effector cells, such as T cells or NK cells, at different Effector: Target (E:T) ratios. Target cell death leads to the loss of fluorescent labels that can be measured and this loss of fluorescence acts as a marker for cell death (Figure 2). Conveniently, many experimental conditions can be tested and imaged on one standard microwell plate, allowing for ultimate flexibility in assay design.

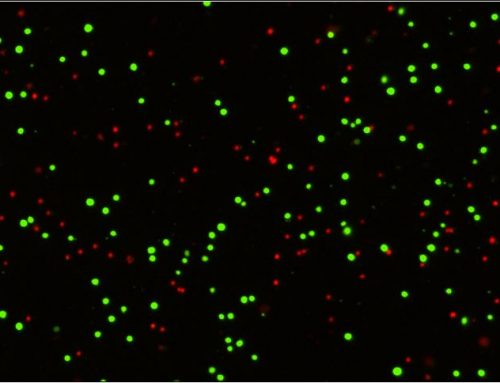
Figure 1: Standard data output from an imaging cytometry cytotoxicity assay. Panel A (top) shows an overlay of the brightfield and green channel images, with a magnified view of labeled (live) cancer cells and those that have lost their fluorescence. The smaller effector cells can also be seen in this image. Panel B (bottom) demonstrates the effect of IL2 stimulation and larger E:T ratios on the presence of labeled target cells, as there are fewer green target cells present when high numbers of IL2-stimulated target cells are present.
In this work, the researchers sought to determine whether a GFP reporter could be used to quantify T-cell activation by imaging cytometry, giving additional information in the assay about the state of the T cells in the co-culture.
To establish that GFP expression correlates with T-cell activation in this model, the researchers isolated CD8+ T cells from transgenic Nur77-GFP mice, then treated the cells with an anti-CD3ε antibody at a range of concentrations. The researchers also included a second dilution series of anti-CD3ε antibodies with a single fixed concentration of anti-CD28 antibodies to evaluate the effects of co-stimulation. GFP fluorescence correlating with anti-CD3ε was observed, indicating T-cell activation. The addition of anti-CD28 antibodies also led to a shift in the EC50 of the anti-CD3ε treatment (Figure 2).

Figure 2: Quantification of T-cell activation using GFP expression and imaging cytometry. A.) schematic of the experimental design. B.) representative images of the treated T cells with analysis of the GFP+ and GFP- populations using the Celigo software. C, D) Quantification of the T-cell activation by GFP fluorescence using counterplots or curve-fit graphs. A dose-dependent response is observed. Figure and text adapted from Chanda et al.
T-cell Killing Assays with a GFP Reporter
Once the GFP reporter system was established, the scientists sought to utilize these cells in a killing assay using the Celigo imaging system. They selected the MC38 cell line as target cells due to its adherent nature and the resulting difficulty in using it for flow cytometric analysis, making imaging cytometry a possible alternative. The OVA protein was used as a model tumor-antigen in this study by generating an MC38-OVA cell line and OVA-specific OT-I CTLs by crossing OT-I TCR transgenic mice with Nur-GFP transgenic mice, then isolating and expanding the OT-I T cells. Thus, the MC38 parental cell line is not recognized by the OT-I CTLs because it lacks the OVA antigen and serves as a negative control.
Experiments were then carried out with the OT-I CTLs expressing GFP when activated and the MC38-OVA cell line to establish whether GFP expression could be used to investigate the relationship between killed cancer cells and activated T cells. In these experiments, killed cancer cells were identified as propidium-iodide (PI) positive, and Hoechst was used as a total cell marker. GFP expression was observed when OT-I CTLs were co-cultured with the MC38-OVA cell line and not the MC38 parental cell line, as expected, with the extent of cell death (PI-positive cells) correlating with the amount of GFP expression (Figure 3).

Figure 3: T-cell activation and target cell killing quantified on Celigo. A.) schematic of the experimental design. B.) Representative images showing GFP expressing T-cells, PI-positive cancer cells, and Hoechst-stained total cells. C-E.) Killing assay data comparing MC38-OVA to MC38 WT. OVA antigen-specific cell killing is observed. Figure and text adapted from Chanda et al.
The authors of the study continue to generate promising data using non-OT-I splenocytes as non-responsive ‘decoys’, solidifying that the killing activity is specific, and successfully using a T-cell activation inhibitor to blunt the T-cell killing response. Taken together, this paper successfully demonstrated the feasibility of using GFP as a reporter for T-cell activation, representing a new phase in how T-cell killing assays can be conducted on the Celigo imaging system.
Evolving Tools
As this paper shows, the Celigo Imaging Cytometer continues to be a cutting-edge research tool for immuno-oncologists. From directly counting cells in brightfield to measuring CAR-T and NK cell killing without disruption, to 3D spheroid viability and invasion models, the Celigo is an easy-to-use instrument for a wide range of applications. Learn more about these experiments on our website or contact us directly to book a seminar or live demonstration today.
Reference
Chanda, Monica K et al. “Combined analysis of T cell activation and T cell-mediated cytotoxicity by imaging cytometry.” Journal of immunological methods vol. 506 (2022): 113290. doi:10.1016/j.jim.2022.113290
Leave A Comment