Transcript: Assay Show: Measure Apoptosis using Caspase 3/7 for Suspension Jurkat Cells with the Celigo Image Cytometer
Welcome to the assay show. This video will show you how to perform an apoptosis assay on the Celigo image cytometer using caspase 3/7 and Hoechst reagents.
Let me first take a moment and describe the assay principle.
- DEVD is a caspase 3/7-specific sequence that is coupled with a DNA dye molecule.
- This substrate can freely diffuse across the cell membrane in live cells.
- Once inside apoptotic cells, the caspase 3/7 protein recognizes and cleaves the DEVD sequence and releases the DNA probe.
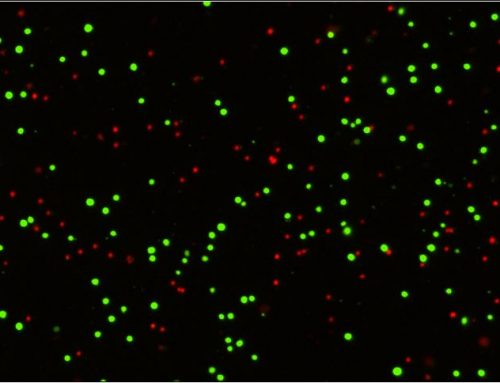
- Once the probe enters the nucleus it binds to the DNA producing a bright green fluorescent signal.
- Hoechst dye was added as a nuclear counterstain for the detection of total nucleated cells
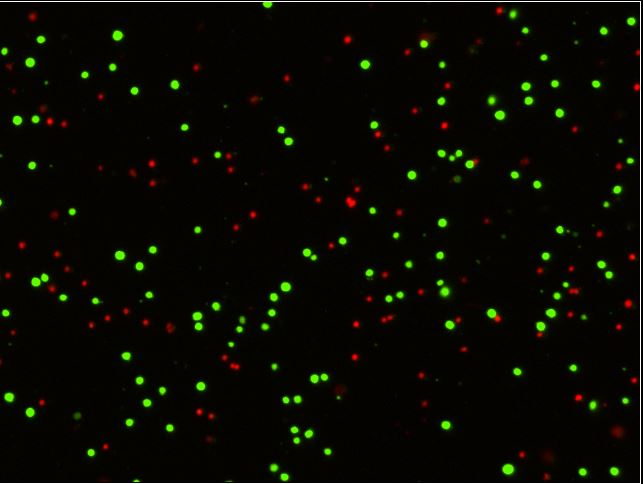
After staining, the Celigo was used to acquire whole well bright field, Caspase 3/7-Green, and Hoechst -Blue images.
The Celigo software automatically analyzes the captured images and reports
the total number of green, caspase positive cells the total number of blue, Hoechst positive nucleated cells and the percent of apoptotic caspase 3/7 cells in the whole population.
The captured bright field images were not analyzed and were used to monitor cell morphology.
Today I will show you an apoptosis assay that was performed using suspension Jurkat cells that were treated with 3 micro molars staurosporine.
To achieve the best accuracy of your cell plating, first, measure the cell concentration by using a Cellometer automated cell counter.
Mix 20 microliters of the cell sample and 20 microliters of trypan blue.
Load 20 microliters of stained sample into the Cellometer chamber slide and perform a cell count to acquire cell number, concentration, and viability of your sample.
Based on the measured concentration of your cells, adjust the volume and per well, plate 20,000 cells with either 3 micro molars staurosporine or vehicle control in a volume of 200 microliters. Centrifuge the plate to settle the cells to the bottom of the wells.
After a 5 hour incubation, remove 100 microliters from each well and add 100 microliters of 2 times Caspase 3/7 and Hoechst staining solution to each well, re-suspend the cells and centrifuge the plate.
Allow the plate to incubate at 37 degrees Celsius for 30 minutes.
Whole-well imaging of 24 wells was captured in three and a half minutes.
The analyzed results are displayed in a plate-based format showing a thumbnail picture and percent of apoptotic cells for each analyzed well.
Let’s take a closer look at a treated sample in well D9.
By double clicking on a well the whole-well image appears for review.
We can zoom in to look at the cell morphology in the bright field image, examine the staining and counting of caspase and Hoechst positive cells.
In this merged image, the blue outlines represent the Hoechst positive total cells, and the red outlines represent the caspase 3/7 positive cells.
Celigo built-in gating interface provides the necessary tools for plotting and analyzing 2D scatter plots.
Optimized settings are automatically applied to the entire plate for easy data analysis.
All the data can be exported to excel as a CSV file in a plate-based layout.
Each excel file contains the number of caspase 3/7 and Hoechst positive cells as well as percent of apoptosis.
Generated bar graphs show an increased number of caspase 3/7 positive cells and percent apoptosis in the staurosporine treated samples.
These and other assays are routinely performed on the Celigo
To learn more or schedule a free in-lab demonstration call us or visit nexcelom.com
Leave A Comment