| Purpose | Monitor the effects of a panel of drugs on the invasion of U87MG Glioblastoma MCTS into Basement Membrane Extract (BME) Matrigel |
| Current Method(s) | Microscopy |
| Target Cell Type | U87MG |
| Experiment Plan | Allow U87MG spheroids to form and treat with a panel of drug compounds, then image at 0, 17, 23, 41, 47, and 68 hours after treatment to measurement the invasion inhibition effects of the compounds |
| Hypothesis | Using the bright field imaging, the Celigo will rapidly provide multicellular tumor spheroid invasion images and the area of the invasion of treated U87MG MCTS |
Celigo Setup
| Plate Type | Nexcelom U-bottom Ultra-low Attachment 384-well Plate (Cat# ULA-384U) |
| Scan Channels | Bright field |
| Resolution | 1 µm/pixel |
| Scan Area | Whole well |
| Analysis Method | Tumorsphere Migration |
| Scan Frequency | 0, 17, 23, 41, 47, and 68 hours |
| Scan Time | ~4 min |
Assay Protocol and Plate Setup
Goal:
Image and analyze the inhibitory effects of a panel of drug compounds on U87MG MCTS invasion into Basement Membrane Extract over time.
Protocol:
Cell Preparation
- Seeded 500 U87MG cells/well in ULA 384-well plates
- On day 4, added serially diluted different drug compounds at 2x and a vehicle control in Basement Membrane Extract (BME) Matrigel
- Monitored invasion by imaging and analyzing each 384-well plate at ~4 min/plate at 0, 17, 23, 41, 47, and 68 hours on the Celigo imaging cytometer
- Measured the invasion area 0, 17, 23, 41, 47, and 68 hours for each drug compound treated MCTS
- Compared the invasion area for each drug compound at each time point to characterize the tested compounds
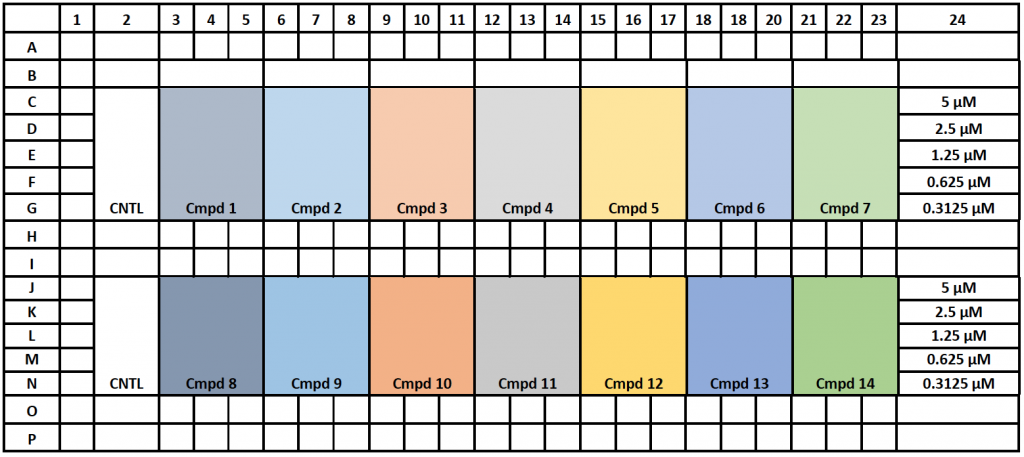
Plate map:
Data Collection
- After adding the drug at different concentrations on day 4, the plates were imaged and data collected for the entire 384-well plate
- The plates were again imaged 0, 17, 23, 41, 47, and 68 hours post-treatment in order to perform time-course monitoring of tumor spheroid invasion area
Data Analysis
- The images were analyzed by using the Tumorsphere Migration application to measure the invasion area of MCTS in the well
- The invasion area of each MCTS treated with different drug compounds was measured
Results
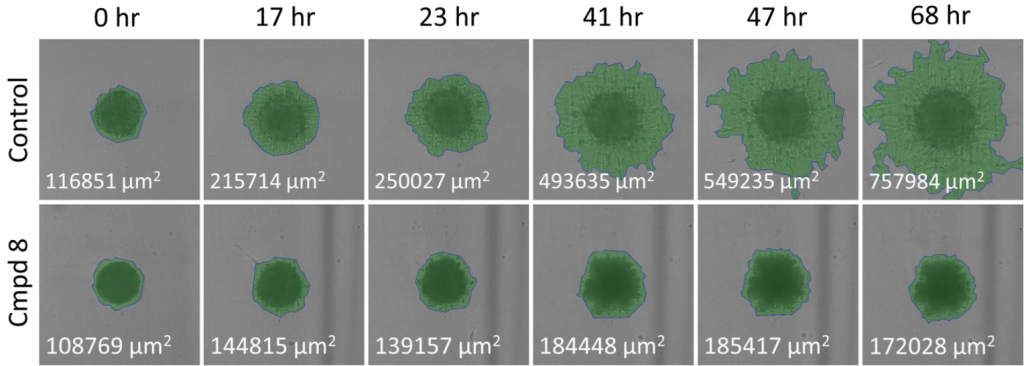
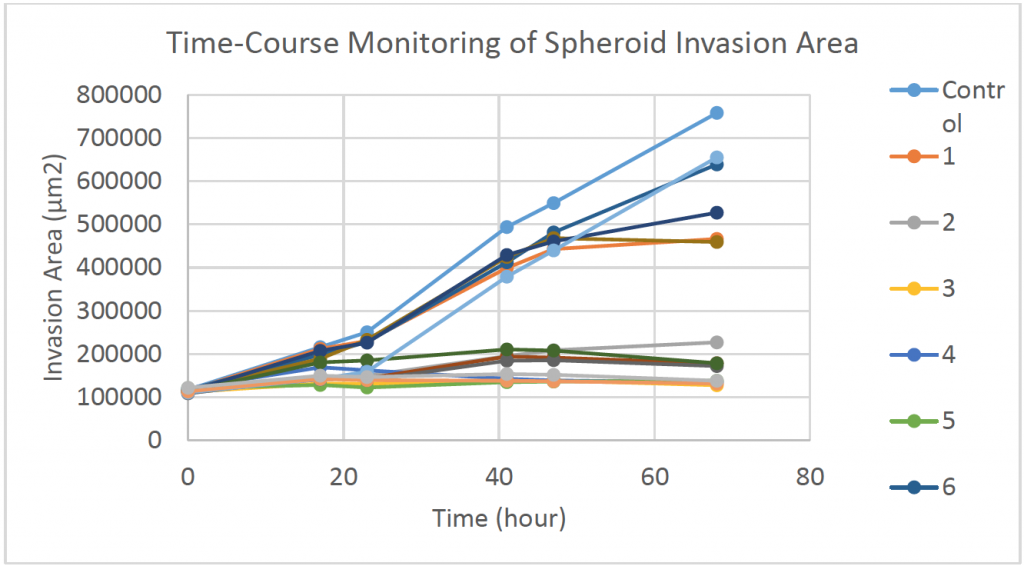
1. Time-course bright field images and results of MCTS for control and treated sample
- The bright field images showed the control MCTS increased in invasion area over, time while the treated sample with compound 8 showed invasion inhibition
- The time-course results showed that some drugs inhibited the invasion at the beginning of the treatment, and some drugs inhibited several days after the treatment
- Some drug compounds did not induce inhibition, similar to the control
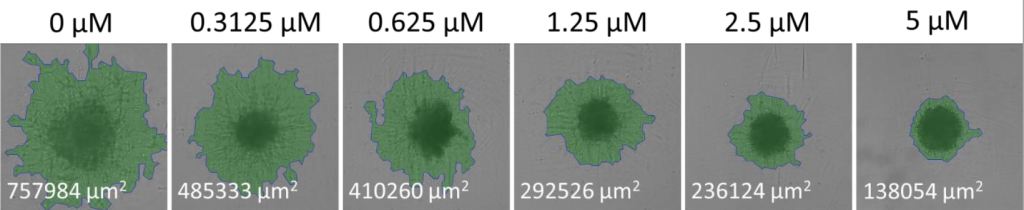
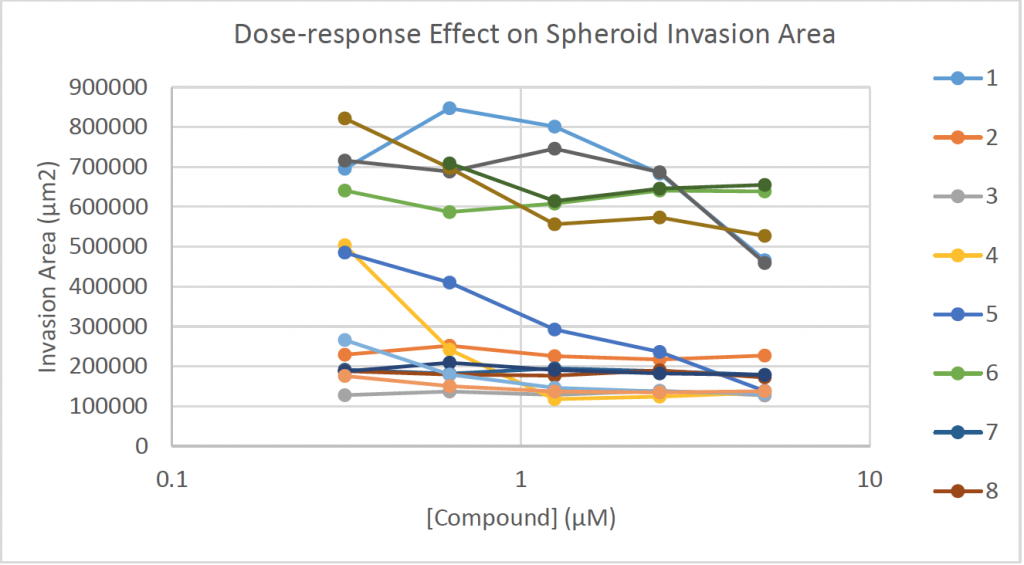
2. Dose-response bright field images and results of MCTS for control and treated sample
- The bright field images showed the dose-response of compound 8 invasion inhibition of MCTS
- As the concentration increased, the invasion area decreased
- The dose-response results showed that some drugs generated great dose response, some drugs inhibited invasion at every concentration, and some drug did not have any effect
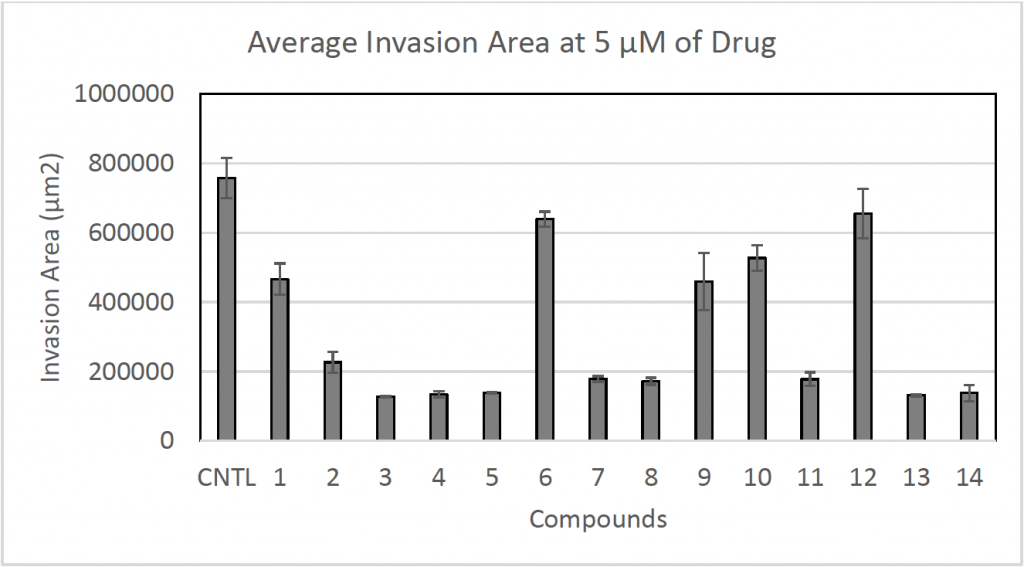
3. Endpoint results of MCTS for control and treated sample
- The endpoint results showed that drug compounds 2, 3, 4, 5, 7, 8, 11, 13, and 14 inhibited the invasion of U87MG MCTS
- Drug compounds 1, 6, 9, 10, and 12 did not inhibit MCTS invasion
Conclusion
- Using the 384-well U-bottom ULA plates, we successfully captured images of U87MG MCTS and analyzed the data using the Celigo imaging cytometer
- The entire 384-well plate was imaged in ~4 min. The short scan time significantly increases the throughput during an experiment that has multiple plates
- After the drug treatments, spheroid invasion areas were measured and automatically reported by the Celigo software
- No additional software was required for image analysis of MCTS diameters invasion area