Primary Cell Counting: Accuracy, Consistency and Sensitivity
Everyone I meet that performs primary cell counting wants to optimize the amount of time they spend doing that task. They also agree that 30 seconds per count sounds pretty good. So why move to a Cellometer automated cell counter? Cellometer delivers that 30-second cell count and is uniquely designed to be accurate over a dynamic range of concentrations [10^5 cells/ml-10^7 cells/ml] and cell sizes [2 micron- 300 micron]. The best part for researchers working on primary cells is Cellometer’s ability to de-cluster and accurately count clumpy cells in samples like PBMCs. Nonetheless, I hear three types of concerns before scientists consider adapting or changing their workflow for primary cell counting.
Accuracy: Got Platelets?
In most labs processing PBMCs, users routinely remind me that they have excellent protocols to rid samples of RBCs. More often than not, what we find to be the most common pain point for PBMC isolation is not residual RBCs but platelets. It becomes important if the workflow is the isolation of fresh PBMCs to go into downstream experiments.
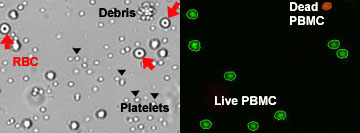
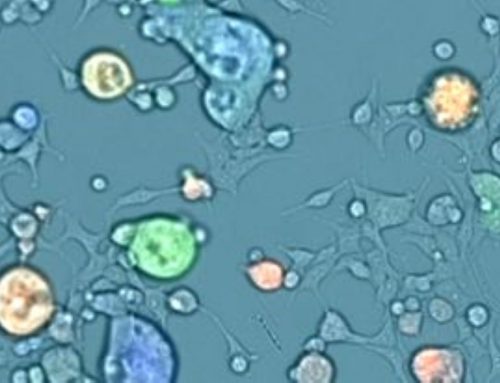
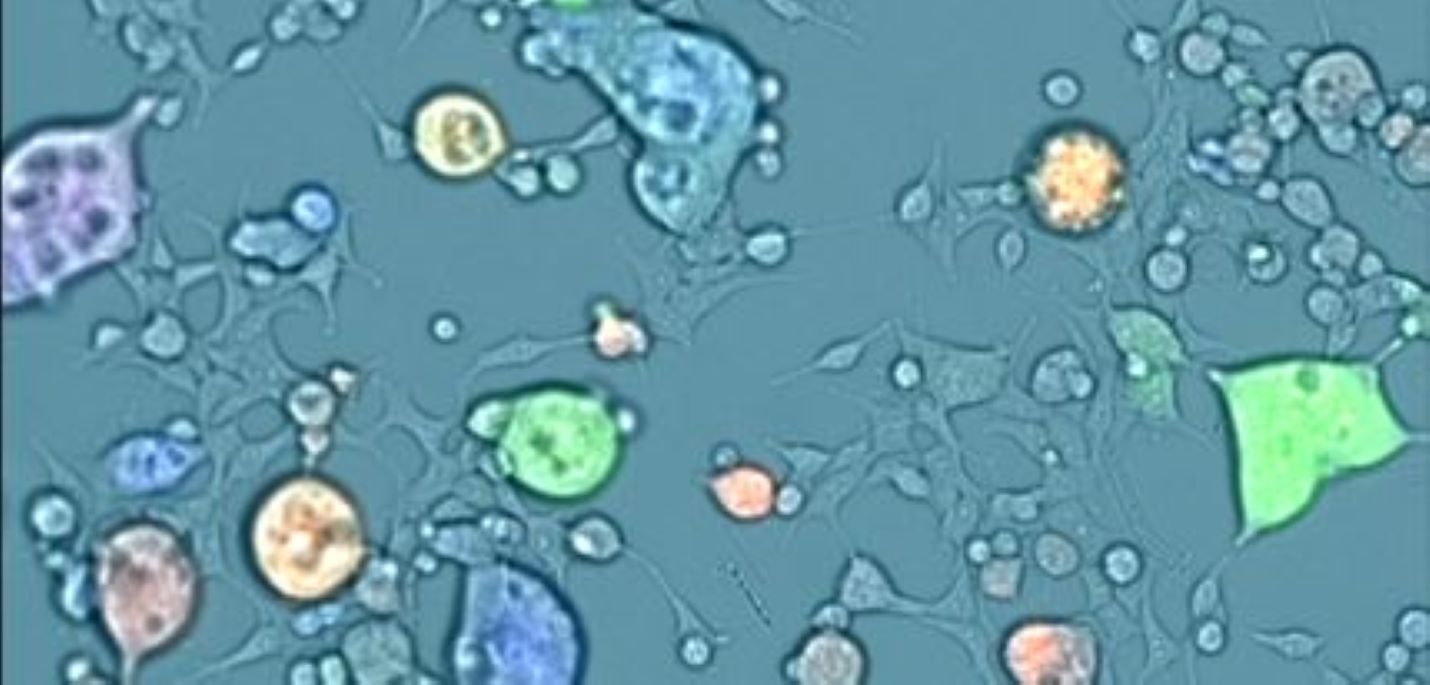
In Cellometer’s workflow, we advocate using dual fluorescent nuclear dyes, Acridine orange (AO) and Propidium Iodide (PI). Staining with the AO/PI method excludes debris, non-nucleated cells (like RBCs and platelets), and provides information for total nucleated cells in the sample regardless of the isolation technique or source. (See figure above). Cellometer AO/PI workflow requires no incubation.
Consistency: How Many Cells in a Clump?
Most of my Cellometer users were trained to count cells using a hemocytometer, a method developed in 1852. While this method is simple and considered a universal gold standard; achieving consistency among users becomes very difficult and subjective. A hemocytometer does not capture images, nor is it easy to count heterogonous mixtures of cells like PBMCs.
| Sample | Cellometer | Hemocytometer |
|---|---|---|
| 1 | 1.73 | 1.12 |
| 2 | 1.90 | 1.03 |
| 3 | 1.77 | 1.01 |
| 4 | 1.77 | 0.80 |
| 5 | 1.63 | 1.04 |
| AVG | 1.76 | 1.00 |
| STDV | 0.10 | 0.12 |
| CV | 5.55 | 12.05 |
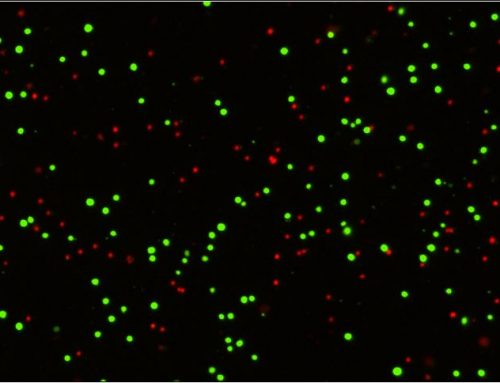
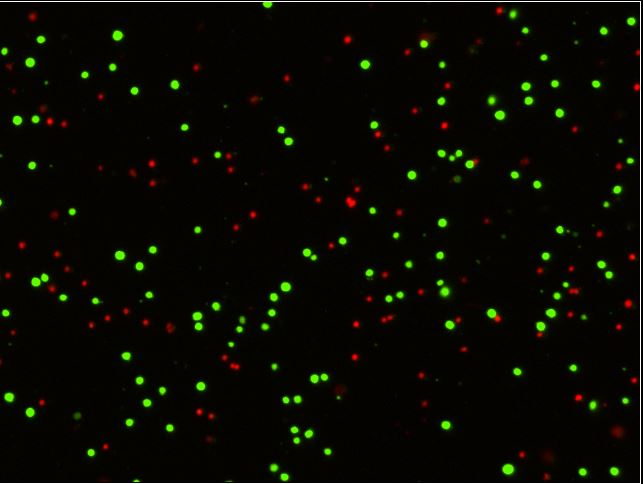
With the AO/PI staining method, live cells will exhibit a green fluorescent signal, while dead PI+ cells will exhibit a red signal (watch the video). With the Cellometer workflow, you are removing subjectivity or operator bias. In my experience, the % CV between users goes from greater than 25% to less than 10% with the correct cell counter. In the table above, PBMC (sample #4) were counted 5 times using a Cellometer and a hemocytometer (experienced operator). Cellometer provided the most accurate and consistent method with %CV less than 6%. It is important to note that the PBMC sample provided was very clumpy, and that it is hard to accurately count cells within clumps by eye. Cellometer’s powerful algorithms will help ensure that only nucleated cells are counted while residual RBCs or platelets do not skew your cell counts.
Sensitivity: Throw Out My Trypan Blue?
I’ve come across several cell therapy workflows (fresh, cryopreserved, long-term passages), where viability checkpoints dictate cryopreservation, number of cells injected in experimental test subjects and other experiment standards. There are consequences to using trypan blue (TB) viability method for counting primary cells. The TB method for manual counting tends to overestimate or inflate the “viability” of samples, especially when samples are less than 70%. This can be a cause for concern given the fact that the current industry standard when it comes to confirming a minimum viability for patient dosing is a viability of 70%. We feel that the decision to use AO/PI (Green or Red), as opposed to the multiple different shades (or concentrations) of blue (i.e. trypan blue method) removes a layer of complexity. The workflow is also cost-effective (20 cents/count).
Compare options for fluorecence cell counters
Check out more information on TB vs AO/PI here.
Want to learn more about the sensitivity of trypan blue versus AO/PI workflows? Stay tuned for our upcoming blog post “Why Are You Using Trypan Blue to Determine Viability Post-Thaw?”
Leave A Comment