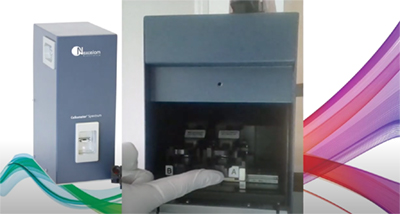
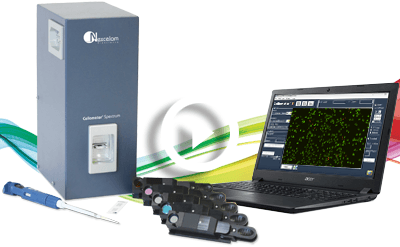
Cellometer Spectrum Image Cytometry System
Customizable Cell Counting and Image Cytometry Instrument
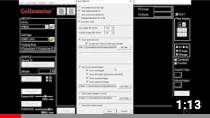
See how the Spectrum Image Cytometer works »
How to setup the Spectrum
How to change fluorescent filters
Novel Method for T-cell Immuno-phenotyping Using Image Cytometry
Features of the Spectrum Image Cytometry System
The Spectrum Image Cytometer is a customizable cell counting and cytometry instrument that provides flow-like data with predesigned templates. Quickly plot cell population data as a histogram, scatter plot, dot plot or contour plot using FCS express.
The filter sets are user-changable, allowing you to customize the instrument for specific assays/reagents of interest.
All-in-One System
Basic cell counting, primary cell viability, and cell-based assays.
Dual-Fluorescence for Accurate Primary Cell Viability
No interference from red blood cells. Analyze bone marrow, peripheral blood, and cord blood without lysing.
User Changeable Fluorescence Filters
Choose from six color options to run two-color assays
Unique Algorithms for Advanced Cell Analysis
Determine concentration and viability of hepatocytes, adipocytes, and other sophisticated cell types.
Fast Results
Obtain cell images, counts, size measurements and viability calculations in < 30 seconds per sample.
“…the Cellometer Spectrum is an economical flow cytometry alternative for small scale simple cell phenotyping and cell counting.”
Simple Cell-Based Assays
- Small 20 µl sample size
- Cell count, concentration and viability
- Two-color antibody assays
- GFP/RFP Transfection
- Cell health and cell-based assays, including:
-
- Apoptosis
- Cell Proliferation
- Cell Cycle
- Mitochondrial Potential
- Phagocytosis
- Surface Marker Analysis

Advantages of Image Cytometry
View Cell Images
- Visually check cell morphology
- Ensure only cells of interest are counted
- Archive and re-analyze cell images
- Export images for publication
Proprietary Pattern-Recognition Software
- Count individual cells in clusters
- Count irregular-shaped cells
- Count cells based on size
- Eliminate debris from cell counts
Non-Fluidic Platform
- Disposable counting chambers – no washing
- Compatible with fragile cells
- Maintenance-free
- Robust optics modules and LED light sources
IQ/OQ Validation and GMP/GLP Accessories
- Installation Qualification reagents/protocol
- Operational Qualification reagents/protocol
- On-site IQ or OQ Performance
- GMP/GLP Software Module


Accurate Cell Counting
Bright Field

Stained AO+ Cells

Counted AO+ Cells


- Automatic identification of Acridine Orange (AO) stained cells (shown above)
- Image and count up to 2×10⁷ cells/mL
- Image acquisition and analysis:
30 seconds/sample for a 3-channel assay - Versatile platform – use for routine cell counting and complex cell-based assays
Proven Results
- Determine cell viability, for cell lines or primary samples, using AO/PI in seconds
- Accurately measure cell samples with varying viability (0 – 100%)

Bright Field

Stained AO+ Cells

Combined Counted Cells

Export to FCS Express* for Flow-Like Data
Counted PI+ Cells

Contour Population Plot

- Export image data into flow cytometry software: FCS express
- Simple workflow: No fluid- stream, No PMT voltages, No forward/side scatter
- Easily perform data analysis using pre-designed templates
- Quickly plot cell population data as a: histogram, scatter plot, dot plot or contour plot
Propidium Iodide (PI) Cell Cycle

* FCS Express Flow Cytometry software is a product of De Novo Software and is included with Cellometer Spectrum
| Cell Population | % of Gated Cells | Concentration (10^6 cells/mL) |
|---|---|---|
| Total
Sub G1 G0/G1 S G2/M |
100
3.8 61.9 15.3 19 |
3.18
0.12 1.97 0.49 0.60 |

Histogram of PE CD3+ Jurkat cells
CD3 Bright Field

CD3 PE


| % Total | |
|---|---|
| Q1: CD8 + (PE) | 34.04 |
| Q3: CD4/CD8 – | 20.51 |
| Q4: CD4 + (Green) | 37.42 |
A bright field image (A) of human PBMCs as well as those stained with human anti-CD4-BB515 (B) and anti-CD8-PE antibodies (C) were imaged on the Spectrum. Population analysis was performed using FCS ExpressTM to determine the percentage of CD4 and CD8 positive cells as well as the percentage of cells that were double-negative (D).


Contour map of Jurkat cells, showing GFP+ and RFP+ intensity profiles.
Bright Field

GFP/RFP Positive Cells

User-Changeable Fluorescence Optics Modules*
The Spectrum is designed to hold two user-changeable fluorescence optics modules. Purchase only the modules you need and easily configure the instrument by quickly changing the colors to fit your experimental design.
| Optics Module | Fluorophores | Nucleic Acid Stains |
Fluorescent Proteins and |
|
|---|---|---|---|---|
| S1-452-365
Ex: 370 nm (BW: 36 nm) Em: 452 nm (BW: 45 nm) |
BV421 V450 Pacific Blue |
Hoechst 33342
DAPI ViaStain™ Dead Cell Nuclear Blue |
Calcein AM Violet CTV (CellTrace Violet) Tracer Blue BFP |
|
| S1-534-470
Ex: 475 nm (BW: 42 nm) Em: 534 nm (BW: 42 nm) |
FITC
AlexaFluor® 488 |
AO (acridine orange)
SYTO®9, SYTO®13 SYTOX®Green SYTO®BC |
GFP YFP Calcein AM CFSE JC-1 |
|
| S1-594-470
Ex: 475 nm (BW: 42 nm) Em: 594 nm (LP – Long Pass) |
Chlorophyll A Chlorophyll B |
|||
| S1-605-527
Ex: 525 nm (BW: 45 nm) Em: 605 nm (BW: 64 nm) |
AlexaFluor® 546
AlexaFluor® 555 Cy3® PE (R-phycoerythrin) RFP |
PI (propidium iodide)
EB (ethidium bromide) SYTOX® Orange |
RFP mCherry TdTomato TurboRed TMRE/TMRM JC-1 |
|
| S1-655-527
Ex: 525 nm (BW: 45 nm) Em: 655 nm (BW: 40 nm) |
PI (propidium iodide) EB (ethidium bromide) 7-AAD |
Nile Red |
||
| S1-692-620
Ex: 628 nm (BW: 40 nm) Em: 692 nm (BW: 40 nm) |
AlexaFluor® 647
APC (allophycocyanin) Cy5® |
SYTOX® Red |
iRFP670 CellTrace Far Red Cell Tracker Deep Red LysoTracker Deep Red |
|
*This table is a partial list of compatible fluorophores, nucleic acid stains, and fluorescent proteins. Please contact Nexcelom technical support regarding compatibility of other reagents.
Sytox, AlexaFluor, and Cy are trademarks of Life Technologies.
Cell Types for Many Research Areas
Optimized for primary cell analysis
PBMCs
Stem Cells
Adipocytes
Neural Cells
Hepatocytes
Dendritic Cells
Epithelial Cells
Keratinocytes
Lymphocytes
Splenocytes
Monocytes
- Clinical Immunology: PBMCs
- Diabetes / Obesity: Adipocytes
- Immunotherapy: Leukocytes
- Microbiology: Yeast (Spectrum 10x)
- Oncology: Cell Lines
- Regenerative Medicine: Stem Cells
- Toxicology: Hepatocytes
- Transplantation: Nucleated Cells
- Vaccine Development: Splenocytes
Cellometer Spectrum Reagents
Cell Counting / Viability Reagents
- ViaStain™ AO Staining Solution (CS1-0108-5mL)
- ViaStain™ PI Staining Solution (CS1-0109-5mL)
- ViaStain™ AOPI Staining Solution (CS2-0106-5mL, CS2-0106-25mL)
- ViaStain™ Calcein-AM/PI Cell Vitality/Viability Kit (CSK-0118)
- ViaStain™ Calcein AM ( CS1-0119)
- DAPI (CS1-0127-2mL)
- Hoechst 33342 (CS1-0128-5mL)
- ViaStain™ Hoechst/PI Viability Kit (CSK-V0005-1)
Yeast Viability & Vitality Reagents (for 10x instrument)
- ViaStain™ CFDA-AM Yeast Vitality Stain (CSK-0125-200µl)
- ViaStain™ Yeast Kit for Live/Dead Concentration (CSK-0102-2mL, CSK-0102-10mL)
- Yeast Dilution Buffer (CS0-0110-500mL)
Apoptosis Reagents
- Annexin V-FITC (CS1-0114)
- ViaStain™ PI Staining Solution (CS1-0116)
- Annexin V Binding Buffer (CS0-0115-100ML)
- CaspGLOW™Fluorescein Active Caspase-3 Staining Kit (K183-100-N, K183-25-N)
- CaspGLOW™Fluorescein Active Caspase-8 Staining Kit (K188-100-N, K188-25-N)
- ViaStain™ Live Caspase 3/7 Detection for 2D/3D Culture (CS1-V0002-1)
- ViaStain™ Live Caspase 3/7 Detection with Hoechst (CS1-V0003-1)
Cell Cycle Reagents
- ViaStain™ Cellometer PI Cell Cycle Kit (CSK-0112)
Proliferation/Tracer Reagents
- ViaStain™ Total Cell Nuclear Green (CSK-V0008-1)
- ViaStain™ Total Cell Nuclear Red (CSK-V0009-1)
- ViaStain™ Total Cell Nuclear Far Red (CSK-V0010-1)
- ViaStain™ Dead Cell Nuclear Green (CSK-V0012-1)
- ViaStain™ Dead Cell Nuclear Red (CSK-V0013-1)
- ViaStain™ Dead Cell Nuclear Far Red (CSK-V0014-1)
- ViaStain™ Dead Cell Nuclear Blue (CSK-V0015-1)
- ViaStain™ CMFDA (CS1-P0001-1)
- ViaStain™ CFSE (CS1-P0002-1 )
Cell Health/Fitness Reagents
- ViaStain™ Cell Fitness Panel for Cellometer Spectrum (CSK-V0023-1)
Cellometer Spectrum Specifications
| Includes |
|
| Magnification Selection |
|
| Imaging Performance | 5x magnification Cell Size: 5 – 300* microns, Conc. Range: 105 – 107 cells/ml10x magnification Cell Size: 0.5 – 25 microns, Conc. Range: 105 – 107 cells/mlBright field imaging, fluorescent imaging and pattern-recognition software to quickly and accurately decluster, identify and count individual cells.* Cellometer CHT4-PD300 Slides are required for cells > 80 microns in diameter |
| Instrument Specifications | Weight: 24.0 lbs. (10.9 kg) Dimensions: Width: 6.0” (15.2 cm), Depth: 8.5” (21.6 cm), Height: 14.0” (35.6 cm) Input to Power Adapter: 100-240 VAC, 50/60 Hz, 1.0A Output to Instrument: 12 VDC, 3.34A |
| PC / Laptop Minimum Requirements(If purchasing Cellometer without PC laptop) |
Intel Mac with Parallels/Running Windows 10 |
Cellometer Spectrum Resources
Manual
Brochure
Videos

Unboxing and Getting Started with Cellometer Spectrum
Autosave on the Cellometer Spectrum