Cytopathic effects of Zika virus on HMC3 and JEG-3 cells measured by fluorescent viability dyes
The Celigo Image Cytometer can utilize fluorescent viability dyes to measure CPE. Researchers from the J. Craig Venter Institute characterized the time-course CPE effect of the Zika virus in placenta and microglia cells by measuring the green (live) and red (dead) fluorescent signals to show where healthy host cells remain after viral infection (read the paper here).

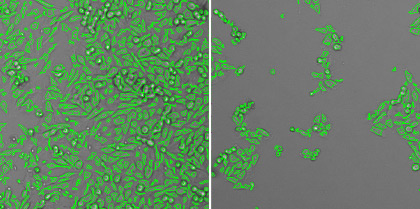
Green and red overlay fluorescent images showing a reduction in the amount of green fluorescent live HMC3 and JEG-3 cells from day 1 to day 5 post-infection.

The time-course CPE effect calculated from plaque formation units per milliliter for HMC3 and JEG-3 host cells.
Example CPE measurement performed using the Celigo Image Cytometer:
CPE of Zika virus on HMC3 and JEG-3 cells
Example CPE measurement performed using the Celigo Image Cytometer:
CPE of Zika virus on HMC3 and JEG-3 cells
The Celigo Image Cytometry system performs high-througput, whole-well imaging and quantitative data in bright field and up to four fluorescent channels for a wide variety of cell-based assays.
Learn more about modern virology assays: