| Purpose | Measure cellular drug uptake in adherent and suspension cell cultures of a fluorescently-labeled drug at varying antibody concentrations |
| Existing Method(s) | Flow Cytometry |
| Target Cell Type | Human normal skin fibroblast |
| Experiment Plan | Target cells are plated, then AF488-drug and antibody are added. Use the Celigo to scan the plate using bright field and green fluorescent channels |
| Hypothesis | The amount of drug uptake changes are dependent on antibody and drug concentrations |
Celigo Setup
| Plate Type | Greiner 655090 96-well black wall clear bottom |
| Scan Channels | Bright field and Green |
| Resolution | 1 µm/pixel |
| Scan Area | Whole well |
| Analysis Method | Target 1 + Mask |
| Scan Frequency | Once |
| Scan Time | ~15 min |
Assay Protocol and Plate Setup
Goal:
The goal of this experiment is to measure cellular uptake of a fluorescently-labeled drug and varying antibody concentrations in an adherent and suspension cell culture.
Protocol:
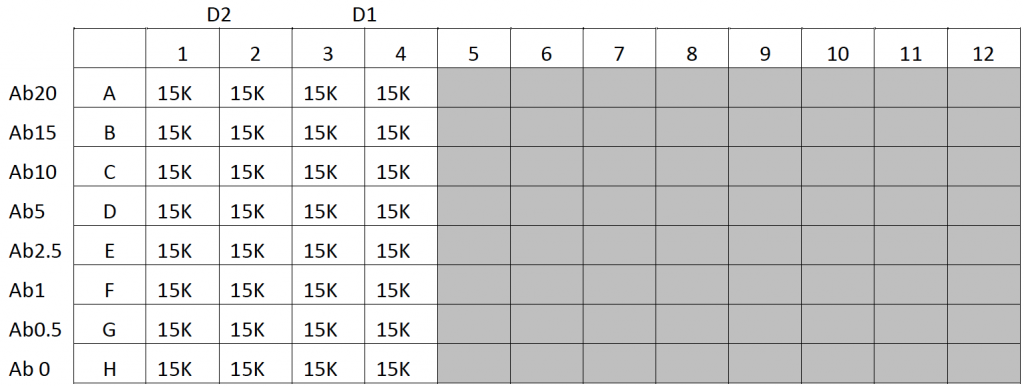
Suspension cell preparation
- Skin fibroblasts were trypsinized and pipetted into a 96-well plate at 15,000 cells/well in 200 µl of media, following the plate map below
- The cells were incubated overnight
- After incubation, different concentrations of Alexa Fluor 488-Drug and antibodies were added to the wells and incubated for 3 hours (Plate Map Below)
- After incubation, the cells were trypsinized and washed
- The cells were reseeded at 200 µl in PBS into a new 96-well plate
- The plate was imaged and analyzed using Celigo
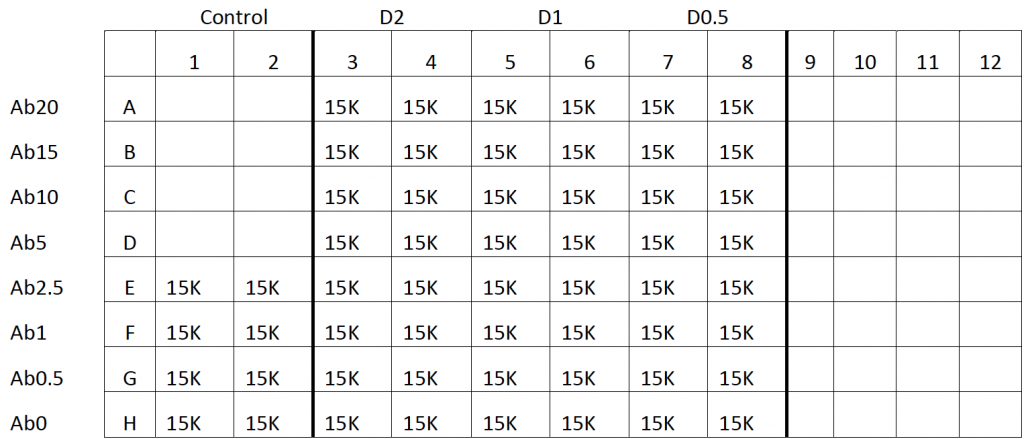
Adherent cell preparation
- Skin fibroblasts were trypsinized and pipetted into a 96-well plate at 15,000 cells/well in 200 µl of media, following the plate map below
- The cells were incubated overnight
- After incubation, 2 different concentrations of Alexa Fluor 488-Drug and antibodies were added to the wells and incubated for 3 hours (Plate Map Below)
- After incubation, the media was replaced with 200 µl of PBS
- The plate was imaged and analyzed using Celigo
Data Collection
- The plate was scanned in Celigo using Target 1 + 2 for an endpoint reading
- Target 1 is the green fluorescent channel and Target 2 is the bright field channel
Data Analysis
- The images for each drug and antibody concentration were analyzed to count total number cells in the bright field images
- Next, the fluorescent intensities were plotted in a histogram under the Gate Tab in the Celigo software
- Finally, the percentage of Alexa Fluor 488-positive cells were measured to determine the effect of antibody concentrations on drug uptake level
Results
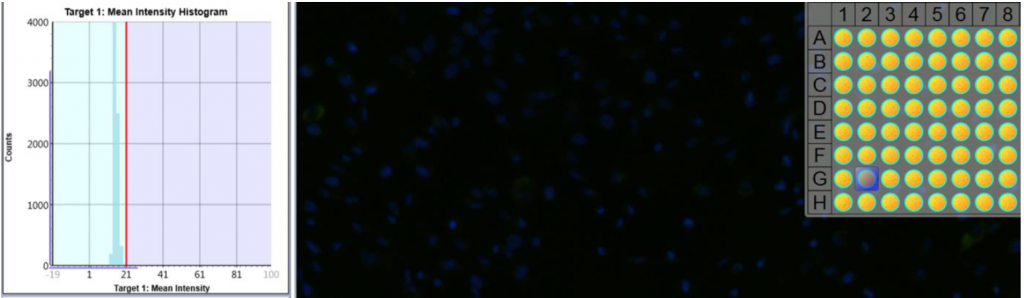
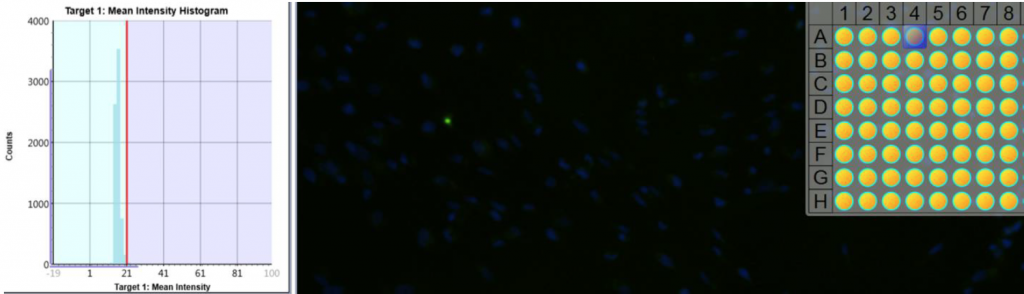
1. Celigo gating function for fluorescent intensity analysis
- Cell images were analyzed by counting the total number of cells (Hoescht) and cells were gated based on the mean fluorescent intensity to determine percent of drug uptake
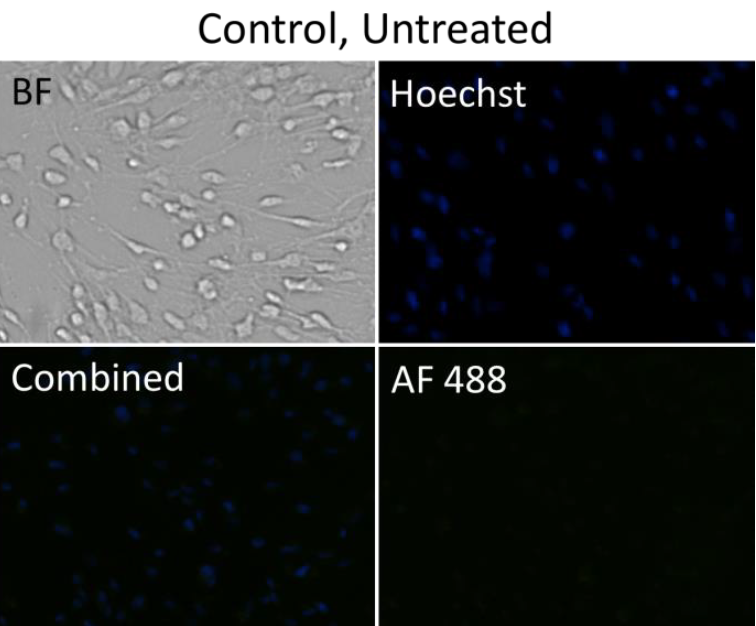
Control, untreated (AF488+Hoescht)
Drug 2, Ab 0.5 (AF488+Hoescht)
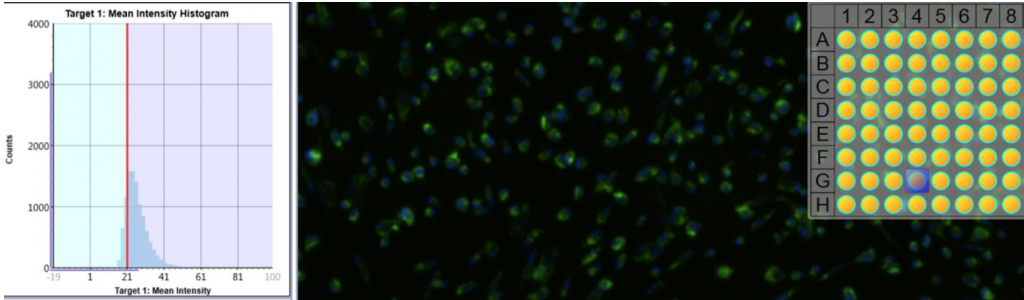
Drug 2, Ab 20 (AF488+Hoescht)
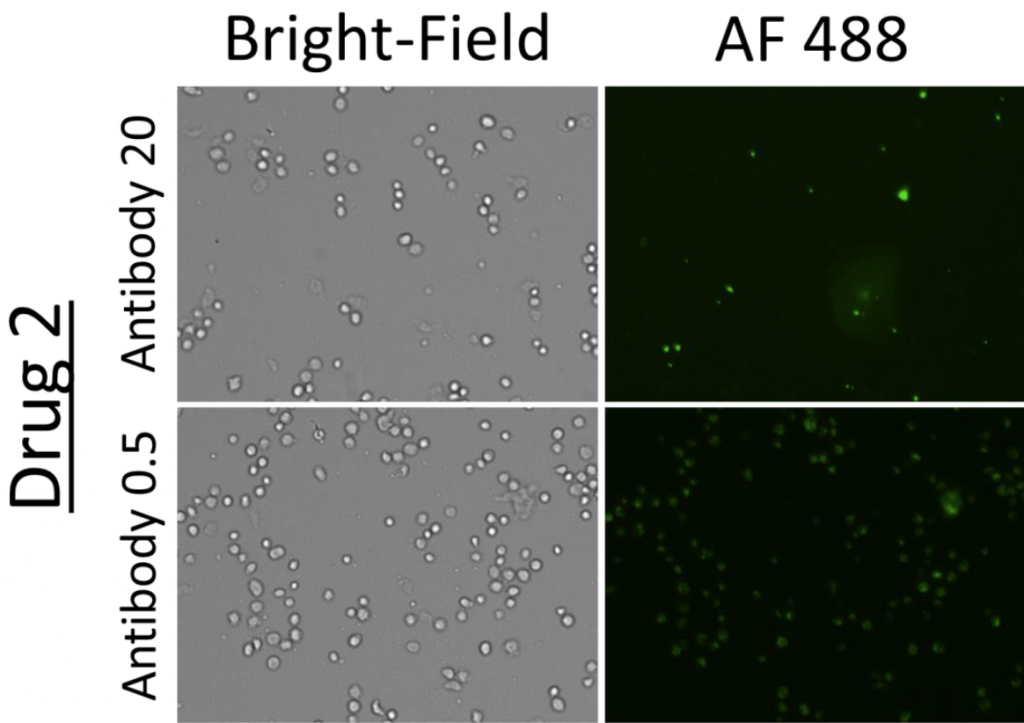
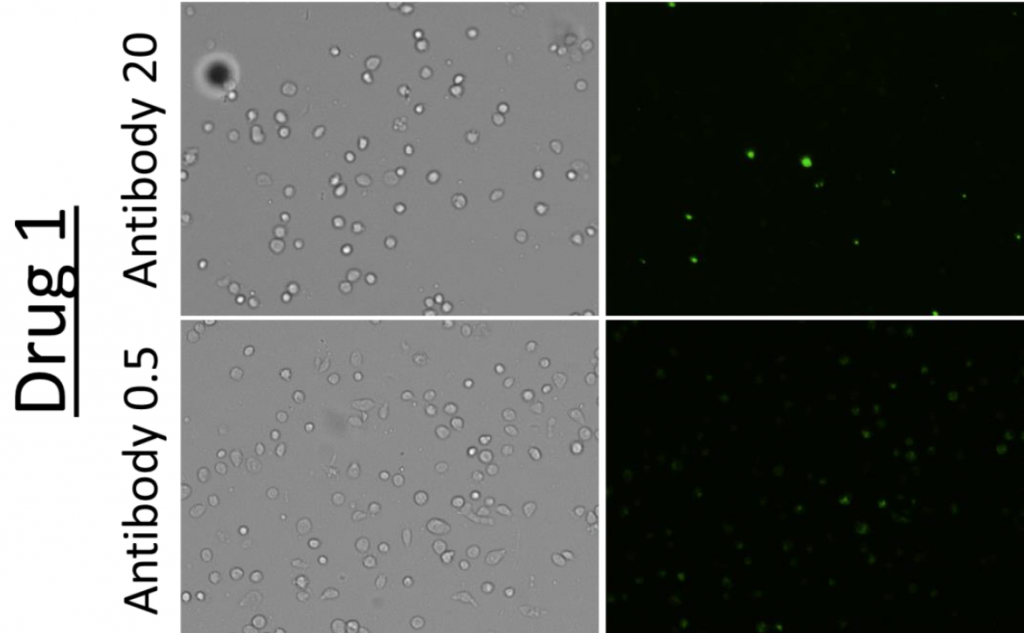
2. Celigo-captured Alexa Fluor 488 fluorescent images for suspension cells
- Bright field and fluorescent images at different drug and antibody concentrations for suspension cells
- Representative images of cells incubated with Drug 2 and 1 at a high (20) and low (0.5) antibody concentration
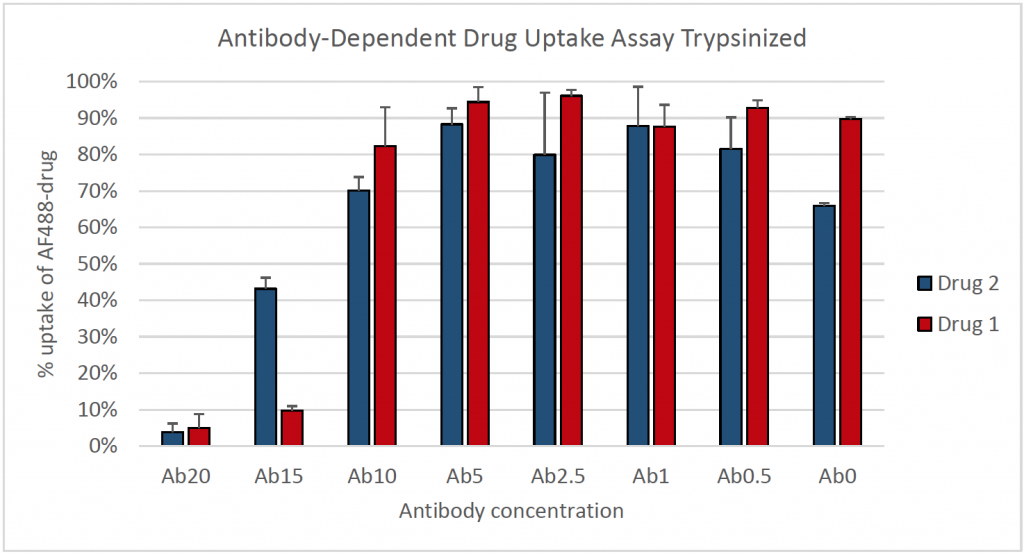
3. Percent cellular uptake of Alexa Fluor 488-drug for suspension cells
- Total cells were counted using the bright field channel and the mean fluorescent intensities were measured within every counted cell
- Lower antibody concentrations incubated with the fluorescently-labeled drug resulted in a higher percentage of uptake of the drug into the cells
- In the wells with higher antibody concentrations, drugs appeared to be aggregating extracellularly and were excluded from the fluorescent intensity data
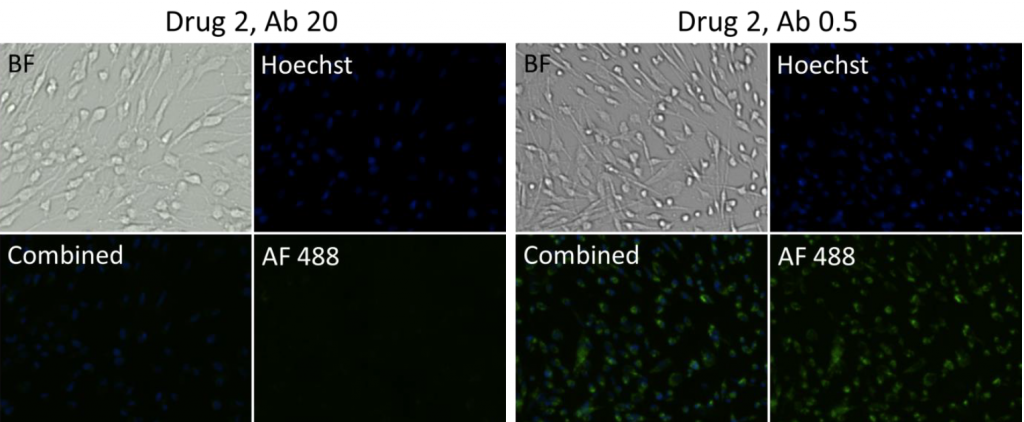
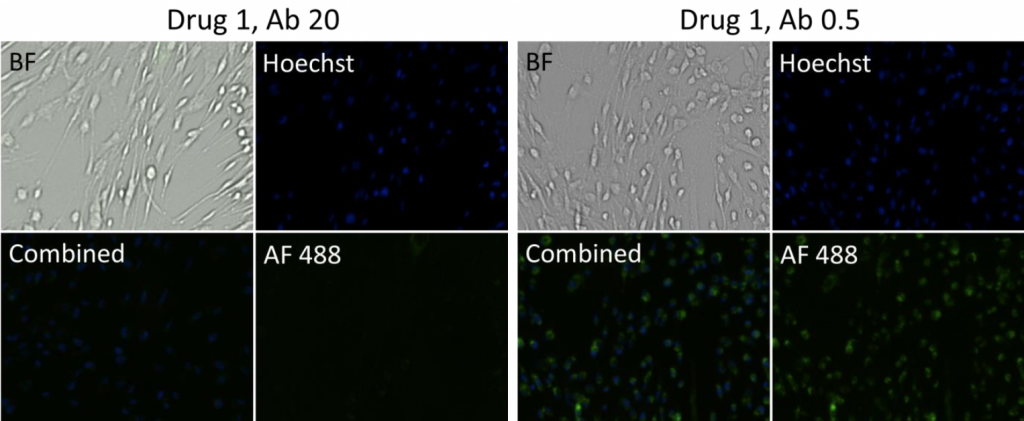
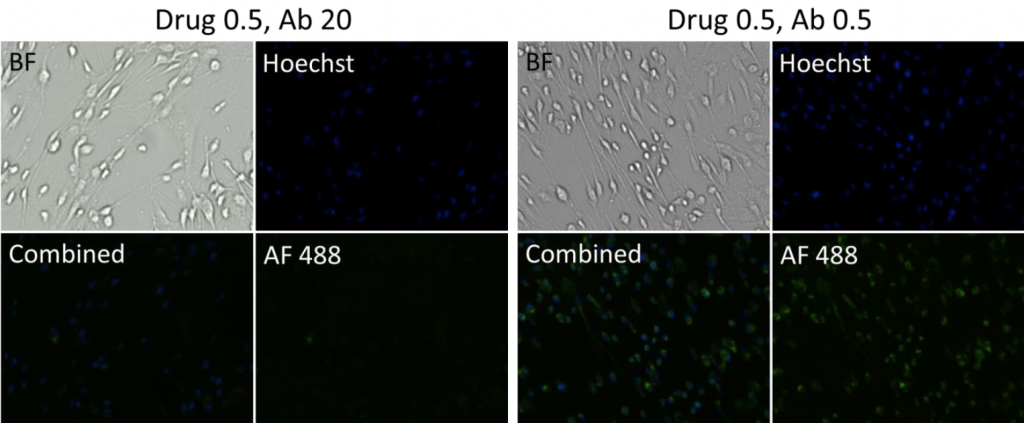
4. Celigo-captured Alexa Fluor 488 fluorescent images for adherent cells
- Bright field and fluorescent images at different Drug and Antibody concentrations for adherent cells
- Representative images of cells incubated with Drug 2, 1, and 0.5 at a high (20) and low (0.5) antibody concentration
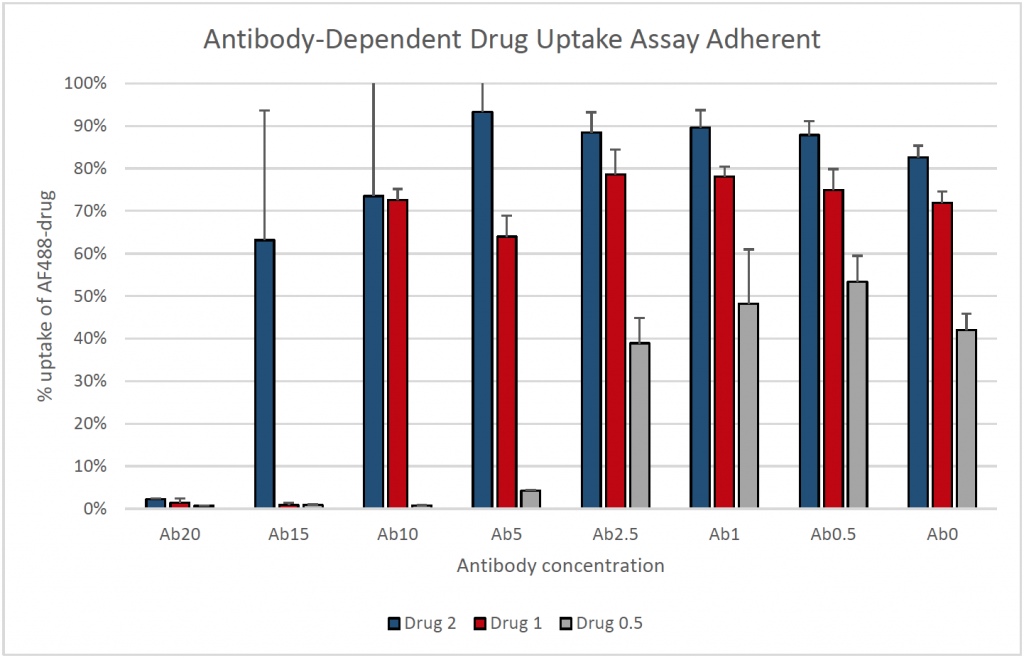
5. Percent cellular uptake of Alexa Fluor 488-drug for adherent cells
- Total cells were determined by Hoescht staining and bright field images were captured for morphological observation
- Mean Alexa Fluor 488 fluorescent intensities were measured from the area surrounding the nuclei for every cell counted
Conclusion
- Adherent cultures of human skin fibroblasts were prepared for a drug uptake assay
- Uptake of the fluorescent drug was inhibited at the higher antibody concentrations in both suspension and adherent cultures
- Using adherent cells in the microplate format allowed researchers to observe the morphological changes in the cell culture
- The results showed an increase in percent uptake as drug concentration increased
- In contrast, the percentage uptake increased as the antibody concentration decreased
- Scanning of one 96-well plate in three channels (bright field, green fluorescence, blue fluorescence) required less than 15 minutes