| Purpose | Measure Jurkat cell concentration and viability at titrations of concentrations and a different mixture of cell viability, which can demonstrate the high-throughput capability of Celigo image cytometer |
| Existing Method(s) | Manual counting; single sample automated cell counting |
| Target Cell Type | Jurkat cells |
| Experiment Plan | Scan plate using the Green and Red Fluorescent channels |
| Hypothesis | By measuring the titration of cell concentrations using AO/PI as well as cell viability, the linearity of the method can be determined |
Celigo Setup
| Plate Type | Greiner 675090 96-well black wall clear bottom half area plate |
| Scan Channels | Green, Red |
| Resolution | 1 µm/pixel |
| Scan Area | Whole well |
| Analysis Method | Target 1 + 2 |
| Scan Frequency | Endpoint |
| Scan Time | ~7 min |
Assay Protocol and Plate Setup
Goal:
Measure Jurkat cell concentration and viability at a titration of cell concentration and viability to determine the linearity of the method. The method can improve the speed and efficiency of cell counting, where numerous samples are required to be counted on a daily basis for bioprocessing, PBMCs samples, or simply cell culture.
Protocol:
Stain preparation
- Diluted AO/PI stain (Nexcelom, Cat# CS2-0106) by 10X in PBS to the working concentration
- Pipetted 25 µL of the AO/PI stain into each well
Cell preparation
- Jurkat cells were obtained from ATCC and cultured in RPMI 1640 media with FBS
- Jurkat cells were collected, diluted in Phosphate Buffered Saline (PBS), counted and brought to a starting concentration of ~1 x 10⁷ cells/ml
Plate 1 Preparation: Serial dilution for linearity
- The Jurkat cell sample was serially diluted 2X to 2,000X with a starting concentration of ~1 x 10⁷ cells/ml
- Each Jurkat cell concentration (5 µL) was then pipetted into the plate according to the plate map shown below
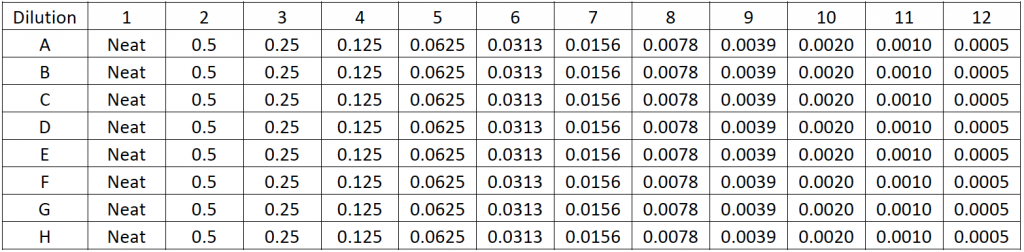
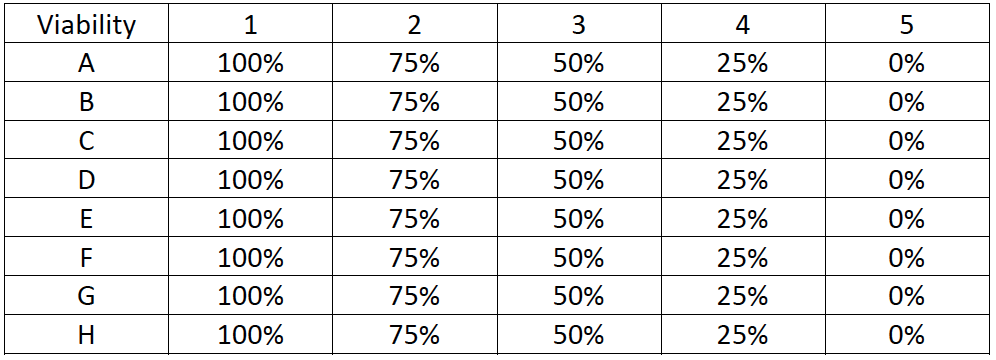
Plate 2 Preparation: Viability assessment with AO/PI
- Half of the Jurkat cells were heat-killed in boiling water for 15 minutes
- After heat-killing, the Jurkat cells were mixed with fresh Jurkat cells to produce 5 different viability samples of 0, 25, 50, 75, and 100%
- Jurkat cells at each viability percentage were pipetted into the plate according to the plate map shown below
Data Collection
- After adding the Jurkat cells, the plate was centrifuged to settle the cells to the bottom
- Immediately after, the plate was scanned in Celigo using Target 1 (Green) + 2 (Red) for an endpoint scan
- This method is used instead of the “Cell Viability” application because the results are exported directly into Excel to calculate the concentration and viability
Data Analysis
- The images for each Jurkat cell concentration and viability were analyzed to count the total number of AO and PI positive cells in the wells
- The segmentation parameters in the Analyze tab were setup using AO and PI fluorescent images, which were used to analyze the entire Jurkat cell titration and viability microplate
- Made sure only the bright AO and PI positive cells were counted
- The parameters were set up to not count pieces of bright debris
Data Calculation
- The AO and PI positive cells were counted and the results were exported to Excel for each plate
- Used the following two equations to calculate concentration and viability
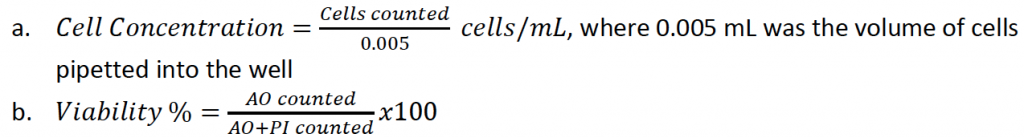
- The concentration and viability were calculated for each well
Results
1. Celigo-captured Jurkat cell concentration series AO fluorescent images
- Below are example AO fluorescent images at different concentrations
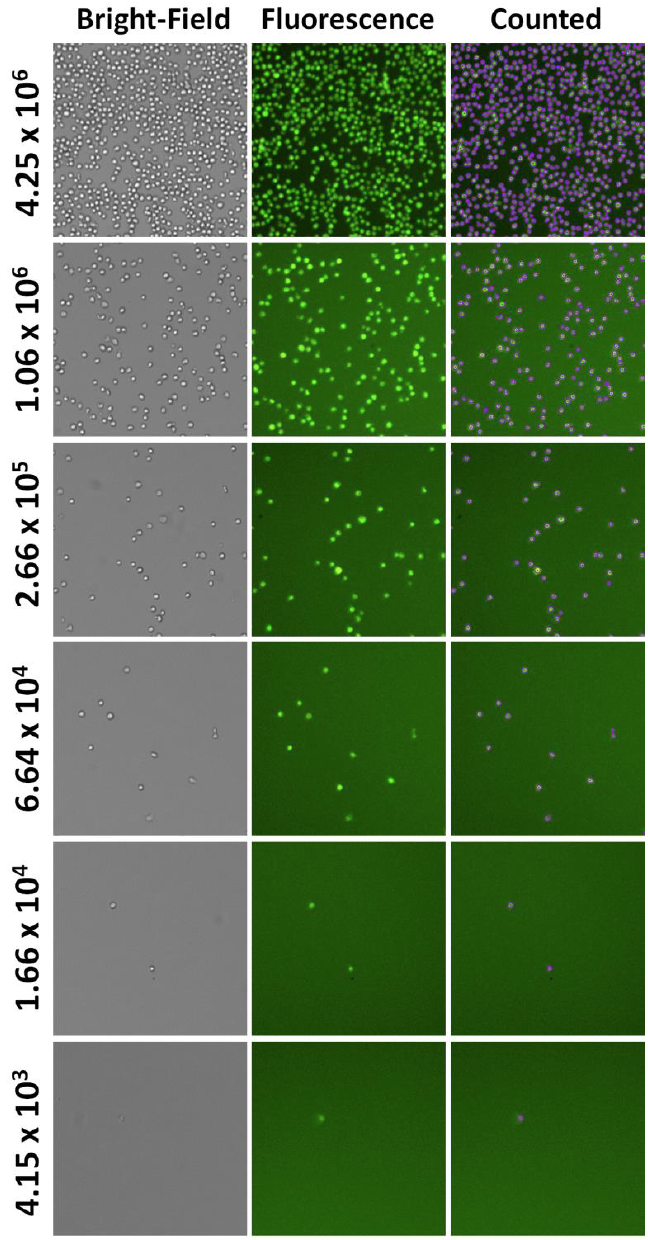
- The Jurkat cell concentrations measured using the Celigo were graphed in a correlation plot to the theoretical concentrations calculated from the dilution factors
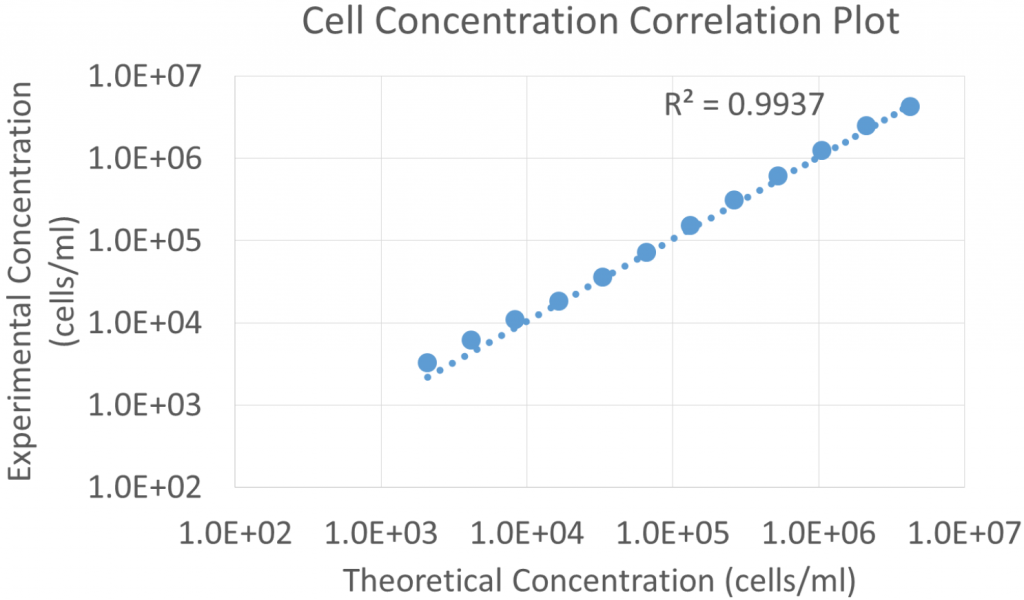
- The results showed a high linear correlation (R2 value = 0.9937) between the measured cell concentration compared to the theoretical concentrations
- The Celigo can measure from 1 cell/well to approximately 1 x 10⁷ cells/ml
- By pipetting smaller volume of cells into each well, the maximum concentration limit can increase
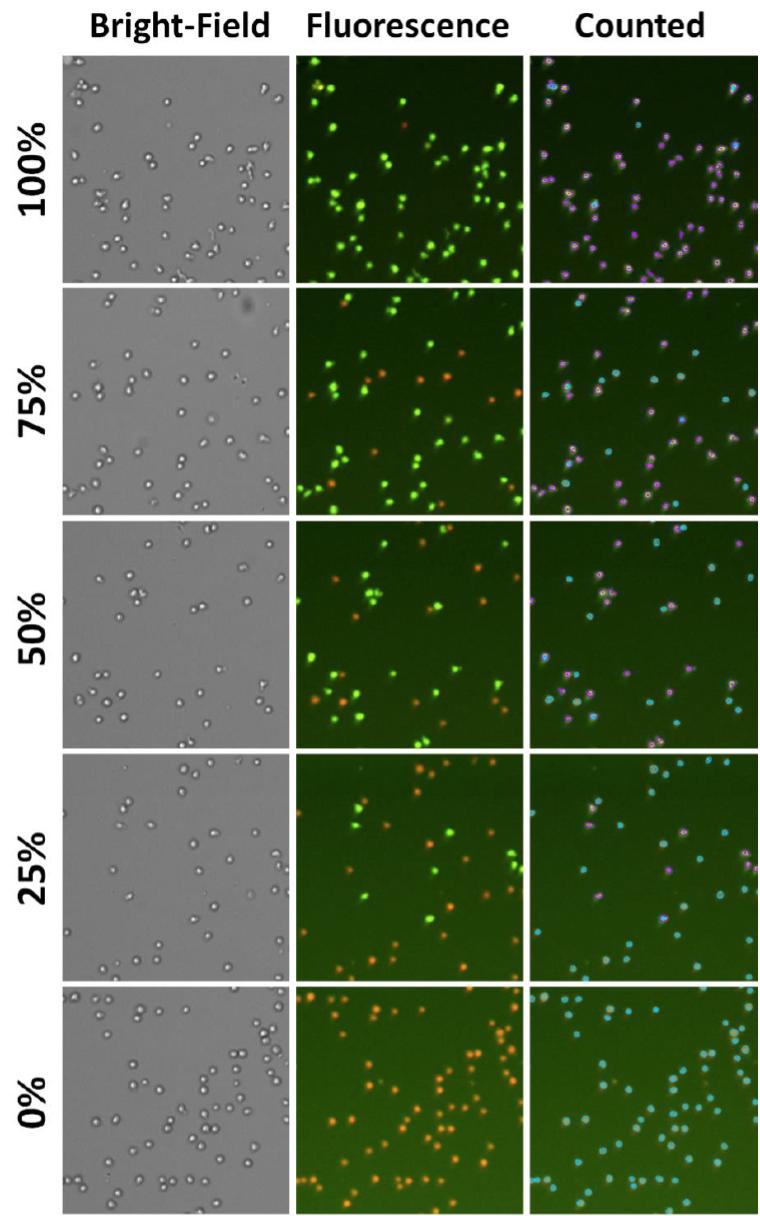
2. Celigo-captured Jurkat cell viability series AO/PI fluorescent images
- Below are example AO/PI fluorescent images at different viabilities
- The number of AO positive cells decreased as the viability decreased
- The number of PI-positive cells increased as the viability decreased
- The Jurkat cell viabilities measured using the Celigo were plotted in respect to the theoretical viability from the different fresh and heat-killed Jurkat mixture
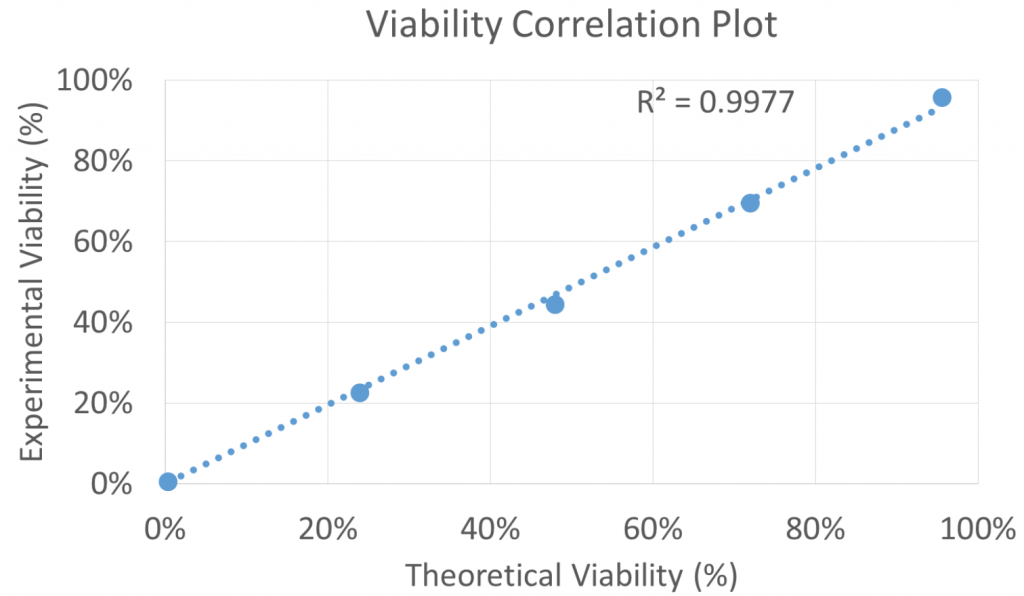
- The results showed a high linear correlation (R2 = 0.9977) between the measured cell viability and the theoretical viability
- The Celigo can measure from 0 to ~100% of viability
Conclusion
- High-throughput cell counting and viability can be achieved using the Celigo image cytometer
- The Celigo was able to measure 2 fluorescent channels in one 96-well plate in approximately 7 min using AO/PI
- The Celigo was able to show high linear results for measuring cell concentrations and viability
- For concentration, the Celigo can count from 1 cell to approximately 1 x 10⁷ cells/ml
- For viability, the Celgio can measure viability from 0 to 100%
- The Celigo image cytometry provides a rapid and simple method for high-throughput cell counting and viability for suspensions cells