| Purpose | In this experiment, we demonstrate the capability of Celigo to measure cell count on microcarrier beads and infected cells positively staining for AlexaFluor488-labeled antibody again the viral protein. |
| Existing Method(s) | Flow Cytometry |
| Target Cell Type | Epithelial cells cultured on microcarriers |
| Experiment Plan | Use the Celigo to count DAPI-stained cells on the microcarrier beads, and count the number of microcarriers to get an average cells/microcarrier. Also, measure AlexaFluor488-positive cells on the microcarriers (cells are stained against viral protein – for viral infectivity) |
| Hypothesis | Depending on the infection rate, a different number of AlexaFluor488-positive cells will be quantified, and average infectivity will be calculated |
Celigo Setup
| Plate Type | Greiner 655090 96-well black wall clear bottom |
| Scan Channels | Bright field + Green + Blue |
| Resolution | 1 µm/pixel |
| Scan Area | Whole well |
| Analysis Method | Target 1 + 2 + 3 + 4 Brightfield – Colony for Microcarrier counts |
| Scan Frequency | Endpoint |
| Scan Time | ~10 min |
Assay Protocol and Plate Setup
Goal:
In this experiment, we demonstrate the capability of Celigo to measure cell count on microcarrier beads and infected cells positively staining for AlexaFluor488-labeled antibody again the viral protein.
Protocol:
Cell preparation
- Obtained microcarrier samples from bioreactors, fixed and stained with DAPI and viral protein of interest with AF488
- After pipetting in the microcarrier beads from spinner flasks into 96-well plates, centrifuged the plate to settle the microcarriers down
- Used the Celigo to scan the microcarrier beads at different focal planes to capture all the nuclei
- In addition, bright field images were captured for the microcarriers, to count the number of microcarriers in the well
- The experiment was repeated by staining with Hoechst and PI to measure the viability of epithelial cells on the microcarriers
- Notes: Potentially staining the cells with the Caspase 3/7 kit following the attached protocol to measure apoptosis
Data Collection
- After centrifuging the plate, scan the plate using the Celigo
- Setup the scanning parameters for 4 channels, where channel 1 and 2 were DAPI and AF488 for the top of the microcarriers, and channel 3 and 4 were DAPI and AF488 for the bottom of the microcarriers
- The Celigo was not able to image and analyze the equator of the microcarriers
- The Celigo was then used to capture bright field images and analyze the number of microcarriers in the well
Data Analysis
- The images from each DAPI and A488 fluorescent channels were counted
- The total number of cells stained with DAPI were counted
- The total number of AF488-positive cells were counted
- The AF488 # / DAPI # was calculated to determine the Infectivity %
- The Af488 # / BF # was calculated to determine the average infected cells/microcarrier
Results
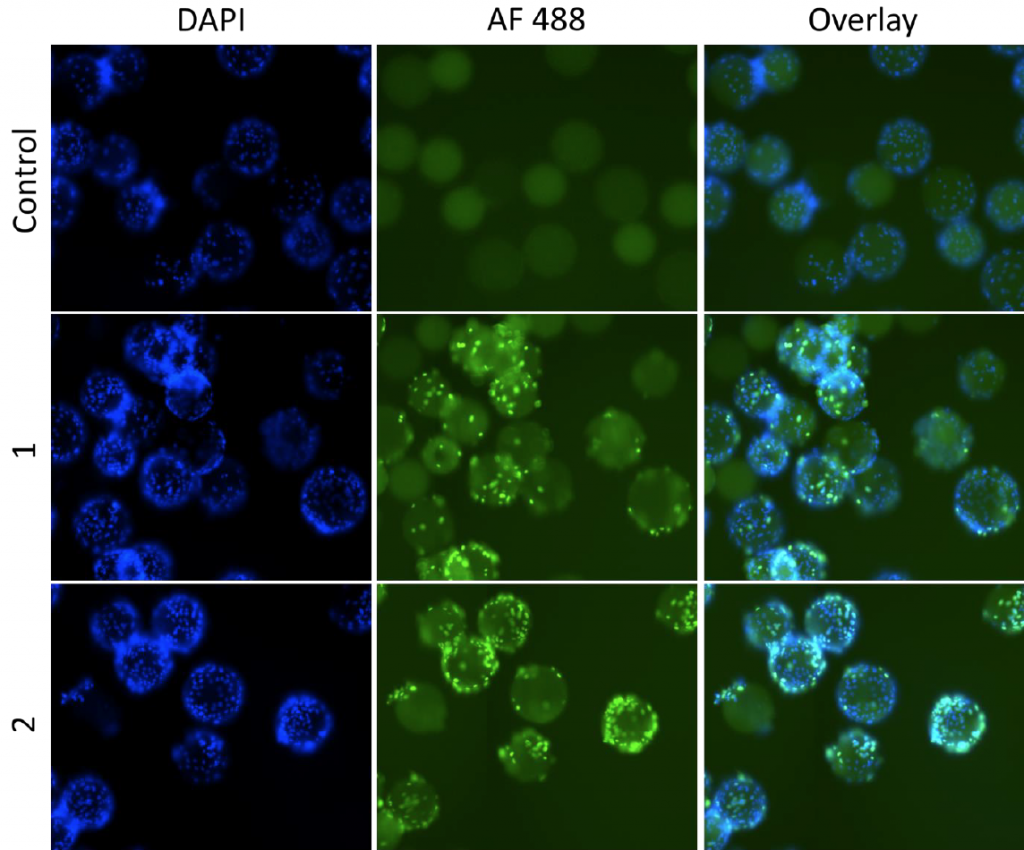
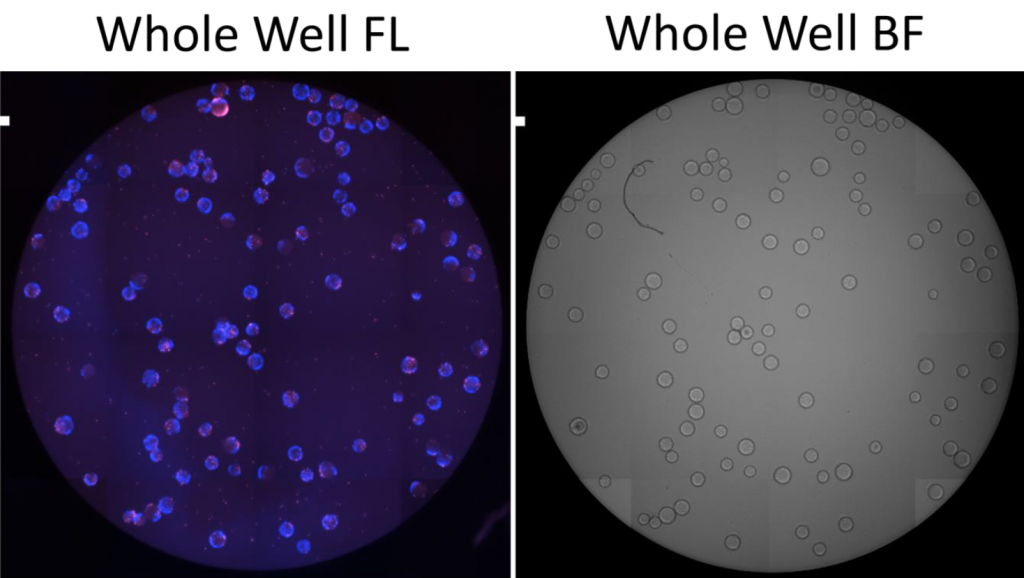
1. Celigo-captured bright field and fluorescent images of DAPI and Alexa Fluor 488
- The Celigo was able to measure % infectivity by counting the total number of DAPI and Alexa Fluor 488 positive cells
- By dividing Alexa Fluor by DAPI, the % infectivity was calculated
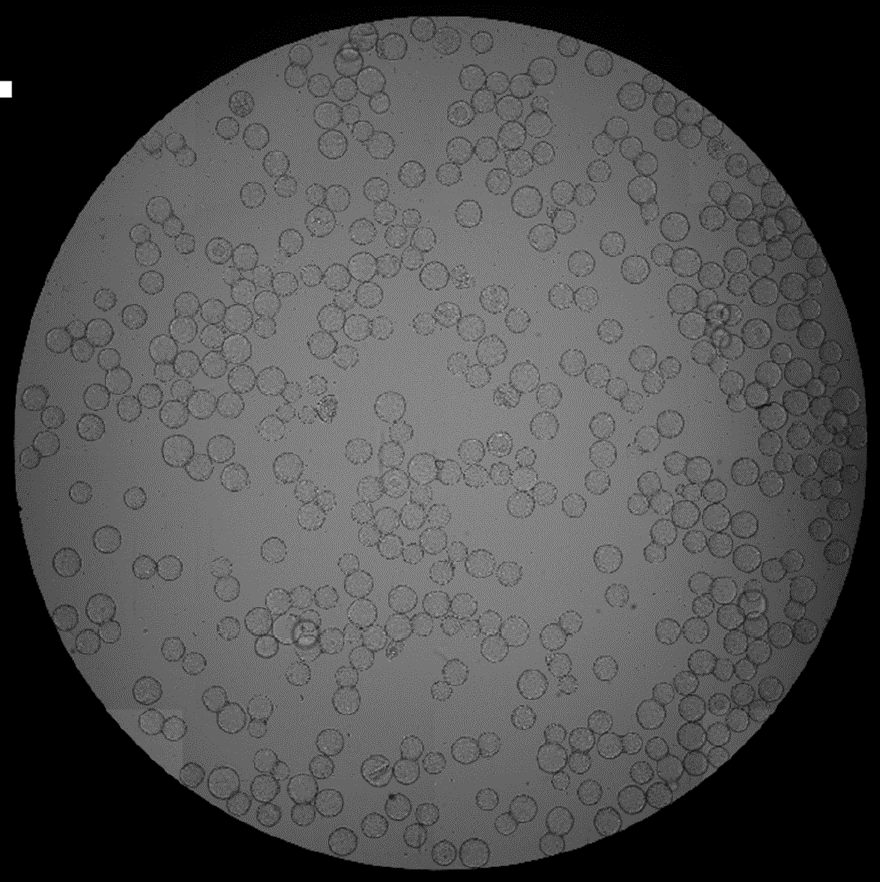
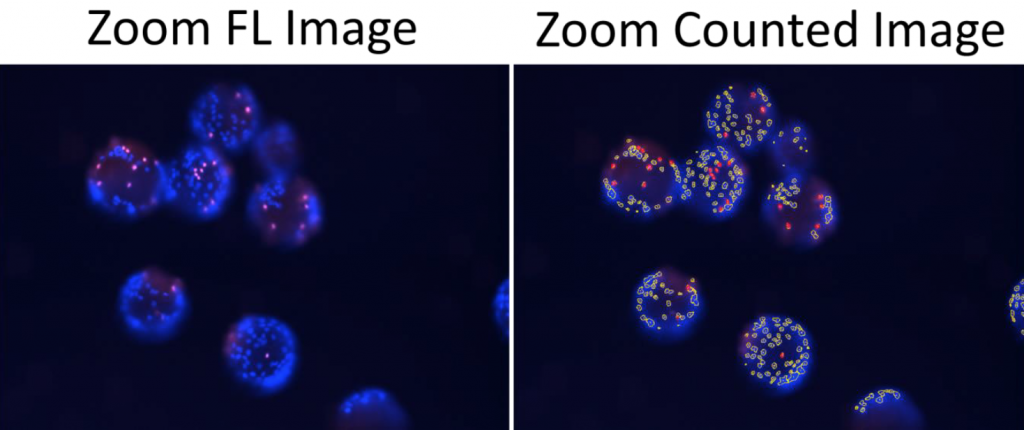
- The whole well image showed all the microcarriers in the well and were counted
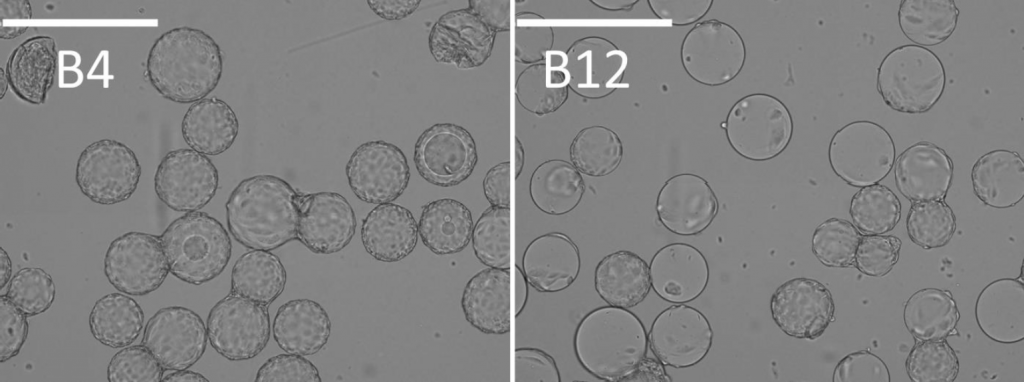
- When zoomed in, the coverage of cells can be clearly observed in two different samples, B4 and B12
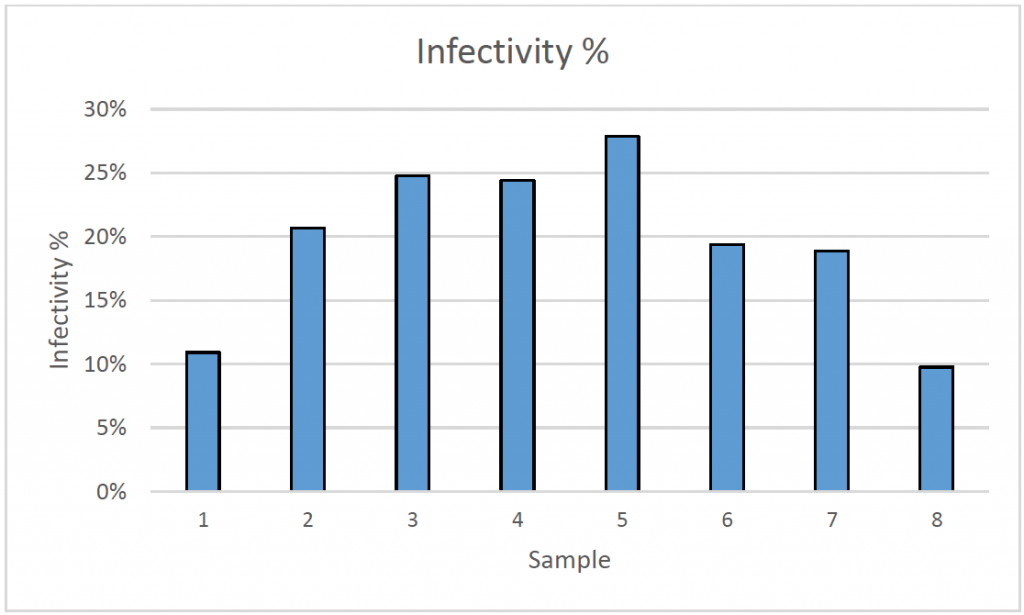
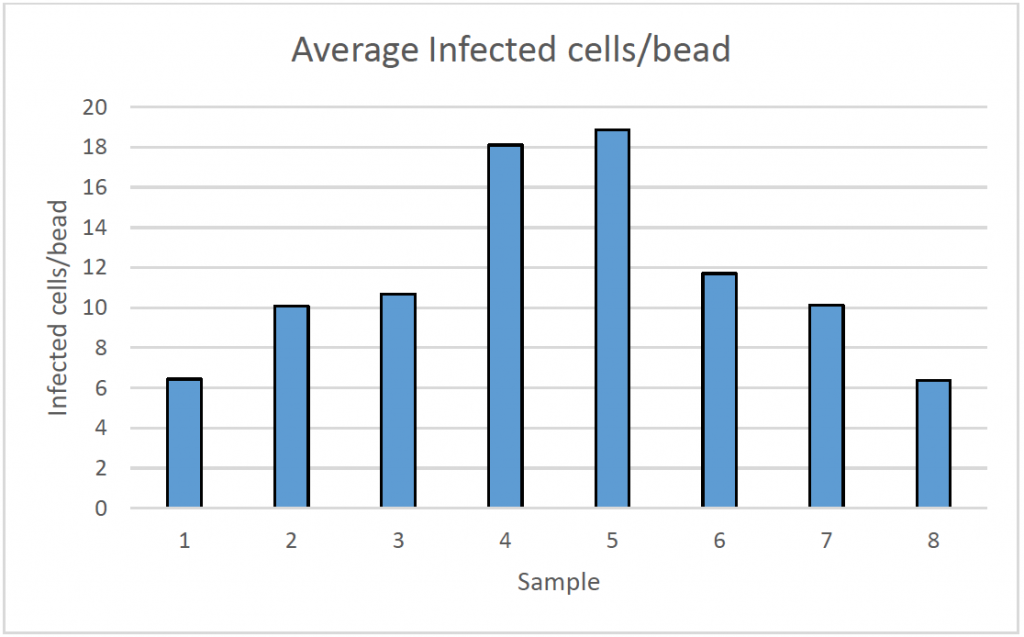
2. Infectivity percentage results
- After measuring DAPI and Alexa Fluor 488-positive cells, as well as the number of microcarriers per sample, the % infectivity and average infected cells/bead were calculated
- The results showed that different samples have a different rate of infection
3. Celigo-captured bright field and fluorescent images of cells and microcarriers for Hoechst and PI
- The Celigo was used to capture bright field images of the microcarriers for counting
- The Celigo was also used to capture Hoechst and PI-stained cells growing on the microcarriers in order to measure the total cell counts per well, and per microcarrier
- Individual Hoechst and PI-positive cells were counted directly in the 96-well plate, as well as the microcarriers, shown in the images below.
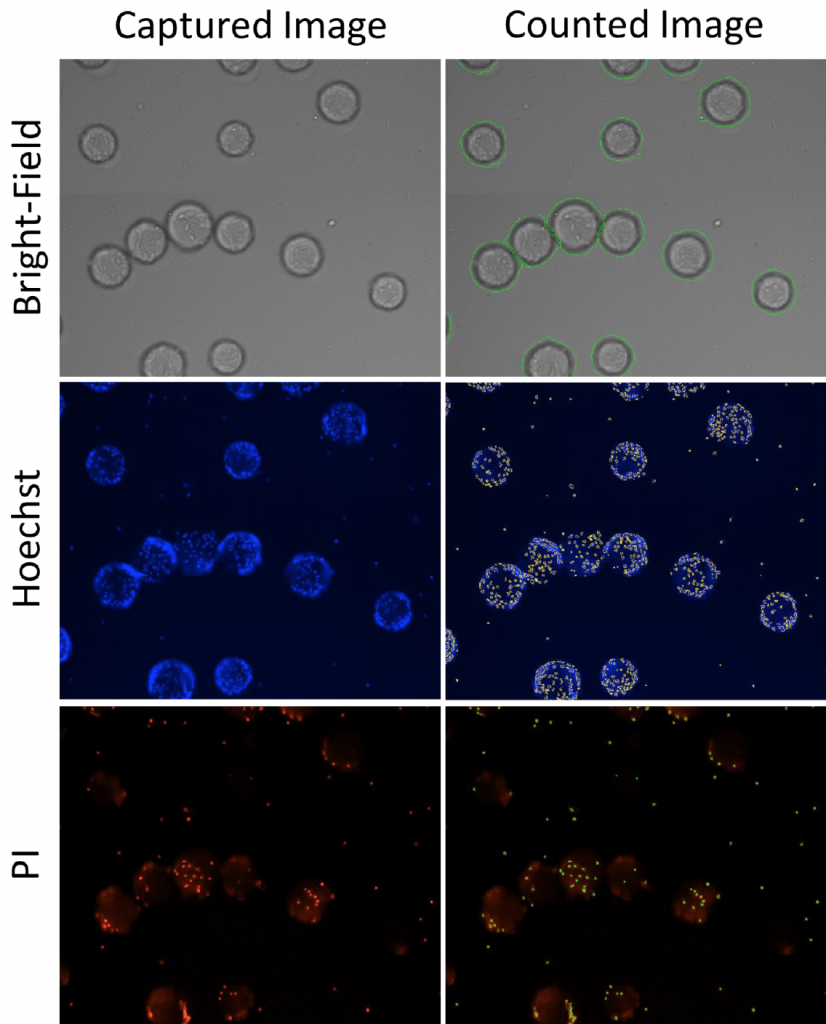
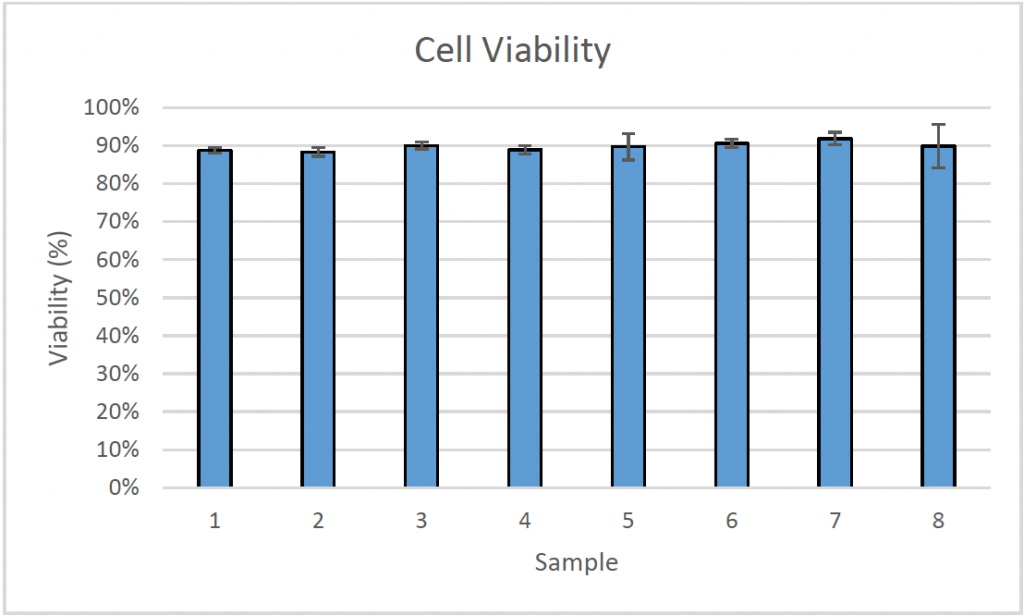
- The cell viability was measured directly on the microcarriers
Conclusion
- Celigo was able to directly measure total cell count and viral infected cell counts of cells on the microcarriers in a 96-well plate format
- The Celigo was also used to quantify virally infected cells per bead in a high throughput manner
- The Celigo analyzed 20 samples in less than 10 minutes total for scanning and analysis
- Celigo was also able to capture blue and red fluorescent images to perform total and dead cell counting using Hoechst and PI
- In addition, the number of microcarriers was also counted in the bright field images
- Overall, the Celigo was able to capture and analyze 64 samples in 15 min
- Finally, high-quality images can be saved and reviewed for record keeping