| Purpose | To analyze transfection efficiency over a 4 day period when treated with various amounts of a transfection compound. |
| Existing Method(s) | Manual observation using a fluorescent microscope |
| Target Cell Type | 293H cells |
| Experiment Plan | Plate transfected cells and measure transfection efficiency for 4 days |
| Hypothesis | Higher viral dosage treatments will lead to higher GFP numbers and fluorescent intensities |
Celigo Setup
| Plate Type | Greiner 655090 96-well black wall clear bottom |
| Scan Channels | Bright field + Green |
| Resolution | 1 µm/pixel |
| Scan Area | Whole well |
| Analysis Method | Confluence Ratio: Confluence 1 + 2 |
| Scan Frequency | Daily |
| Scan Time | ~8 min |
Assay Protocol and Plate Setup
Goal:
To analyze transfection efficiency over a 4 day period when treated with various amounts of a transfection compound.
Protocol:
Cell preparation
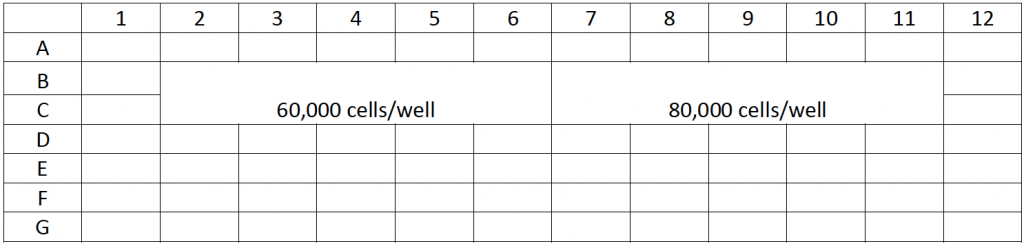
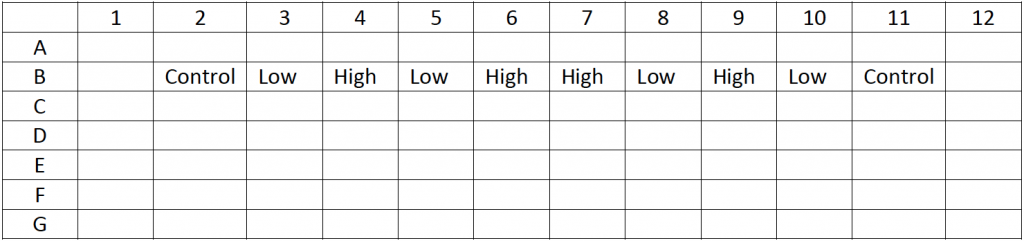
- Transfected cells were collected and plated on Day 0 following the plate map below
- After plating, the plate was centrifuged to settle the cells in the bottom of the dish, in order to image the cells in a monolayer for optimal focus
- Cells were then treated with compounds following the plate map below
- The plate was then imaged using Celigo for bright field and GFP green fluorescence
- The plate was imaged and analyzed on Day 0, 1, 2, and 3
Data Collection
- After centrifuging the plate, the plate was scanned using the Celigo
- The scanning parameters for 2 channels were set up, where Confluence channel 1 + 2 are GFP and bright field, respectively
Data Analysis
- The images were analyzed to measure the total area of cell coverage in bright field and in fluorescence
- The automatically calculated confluence ratio indicates GFP transfection efficiency as a percentage of the total cell area
Results
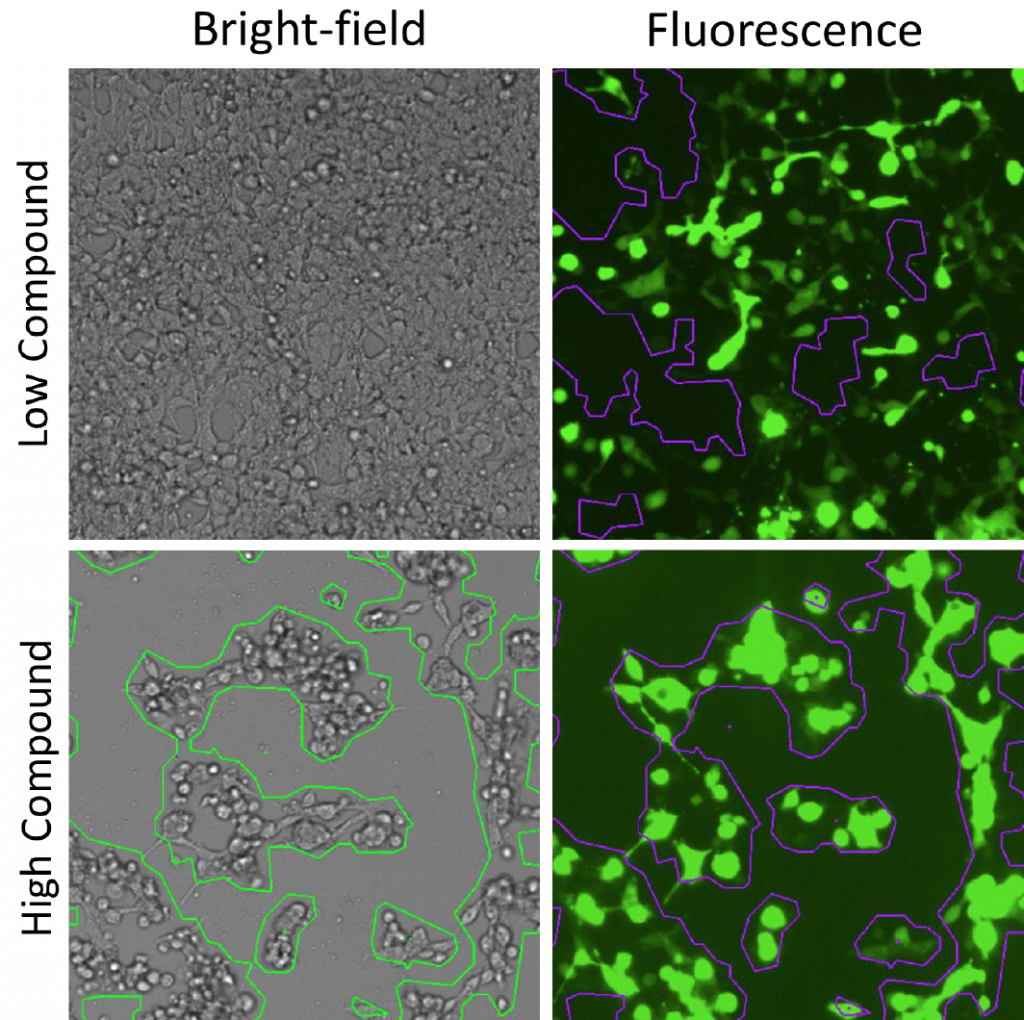
1. GFP expression fluorescent images
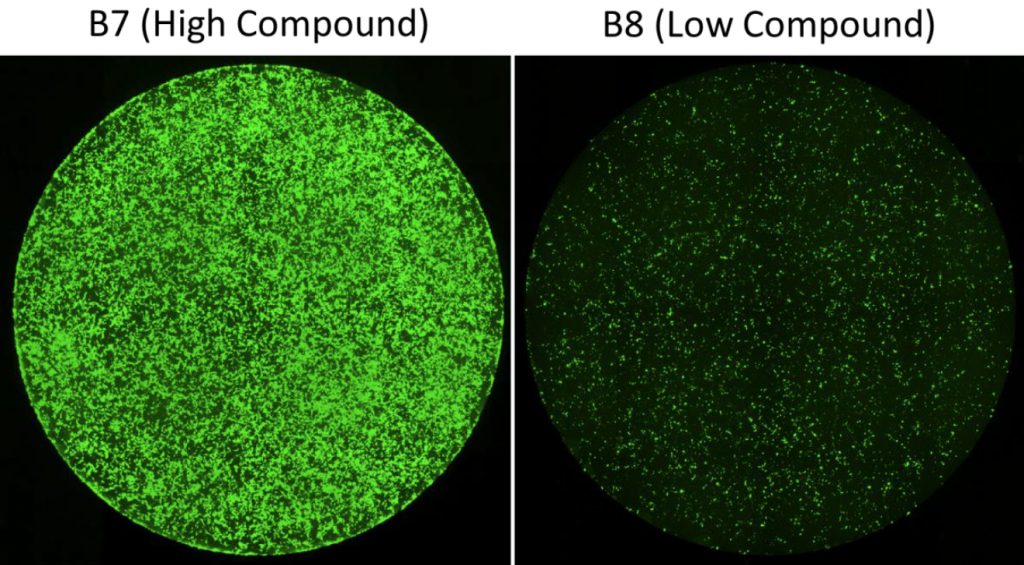
- The GFP fluorescent images showed differences between low and high compound treatment
- The GFP expression plate view is shown below
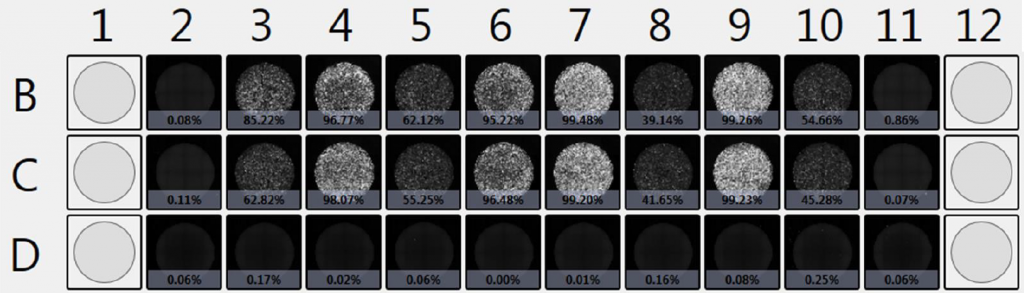
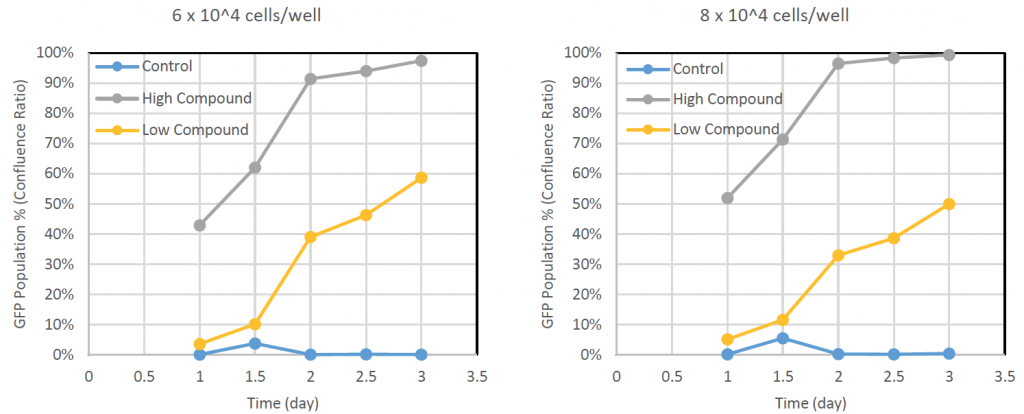
2. GFP transfection efficiency measurement results
- Whole-well fluorescent images reveal the GFP expression level for cells treated with high and low concentration of compound
- The GFP transfection percentage for 60,000 cells/well showed no expression for the negative control, low compound treatment showed 60%, and the high compound treatment showed 100%
- The results were similar for the 80,000 cells/well
3. Bright field confluence level
- The bright field images showed that at high compound treatment, there is a reduction in cell confluency, in comparison to the low compound treatment
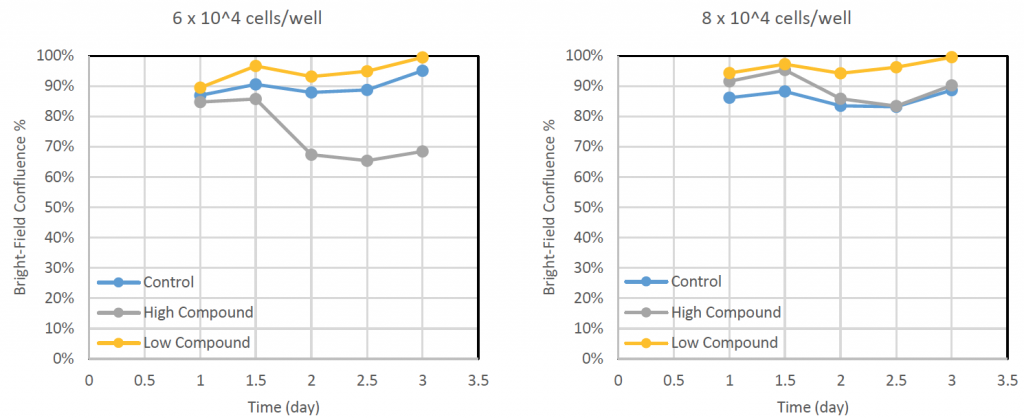
- At 60,000 cells/well, the high compound treatment showed a large decrease in cell confluency
- At 80,000 cells/well, the high compound treatment did not show any decrease in cell confluency
4. GFP transfection time-course images
- Green fluorescent images showed an increase in the number of GFP-positive cells over 3 days of culture
- The low compound treatment resulted in fewer GFP-expressing cells compared to the high compound treatment
Conclusion
- The GFP transfection efficiencies were highly dependent on the compound treatment
- At lower seeding density, the cells showed higher damage due to high compound treatment