| Purpose | Perform kinetic viability assay on MDA-MB-231 and K562 cells |
| Existing Method(s) | Cell Titer Glo, Flow Cytometry |
| Target Cell Type | MDA-MB-231 adherent and K562 suspension cells |
| Experiment Plan | Scan plate using Far Red and Bright field channels |
| Hypothesis | Drug treatment will increase the percentage of DRAQ7-positive cells over time |
Celigo Setup
| Plate Type | Greiner cat# 781091 384-well black wall clear bottom |
| Scan Channels | Far Red, Bright field |
| Resolution | 1 µm/pixel |
| Scan Area | Whole well |
| Analysis Method | Target 1 + 2 |
| Scan Frequency | Daily, for 3 days |
| Scan Time | ~15 minutes |
Assay Protocol and Plate Setup
Goal:
Detect and quantify dead cells using DRAQ7 stain in adherent MDA-MB-231 and suspension K562 cell lines
Protocol:
- Seeded MDA-MB-231 at 2,000 cells/well and allowed to incubate overnight
- Suspension cells were plated the day of experiment with a working solution of DRAQ7 at 3,000 cells/well
- Prepared the drug Benzethonium and serially diluted to generate dose response
- Prepared control with water in media
- Removed the media from the wells of adherent cells
- Added drug dose response and control to both adherent and suspension cells
- Added DRAQ7 to adherent cells only
- Incubated the plate for 24, 48 and 72 hours with drug and dye
- Imaged the plate using the Celigo image cytometer
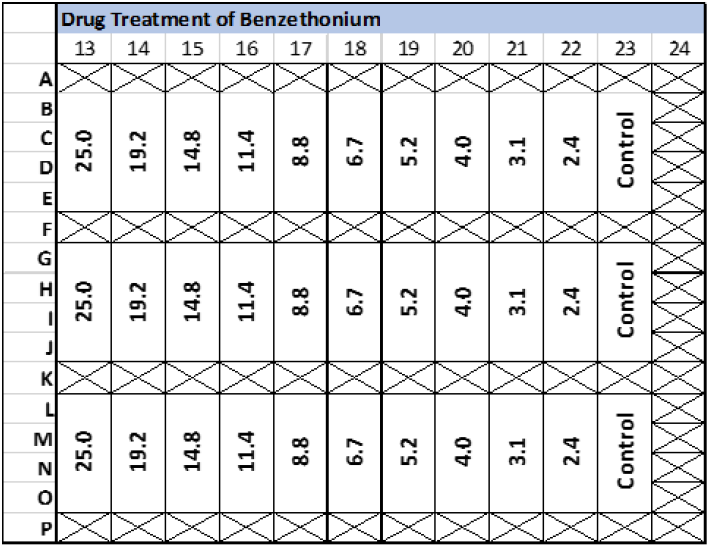
Plate map for Benzethonium (µM) drug treatment and DRAQ7 time point staining
Results
Drug-treated MDA-MB-231 and K562 cells showed an increase in DRAQ7-positive cells
- DRAQ7-positive cells were determined by staining the cells for 24, 48 and 72 hours
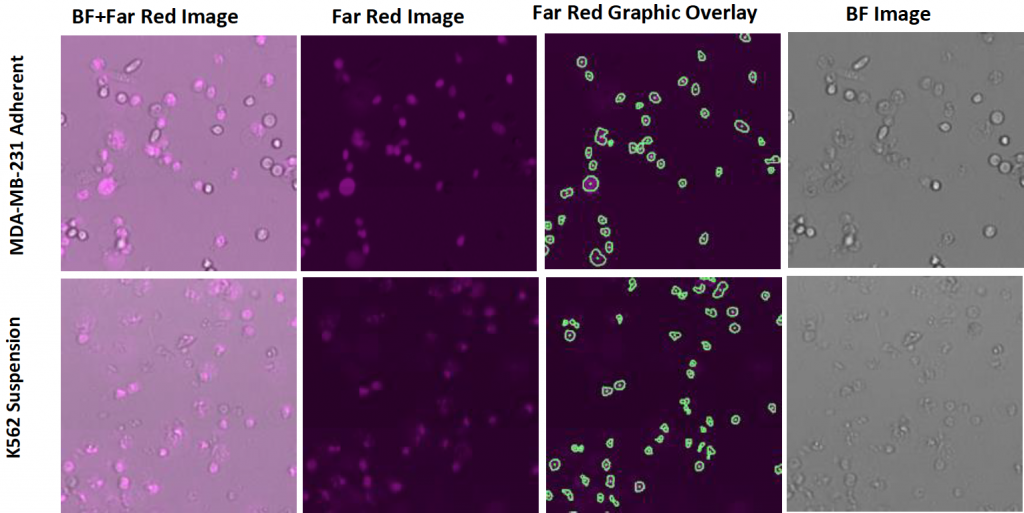
Images and fluorescent object identification looked as shown below for DRAQ7-stained cells “Graphic Overlay” segmentation
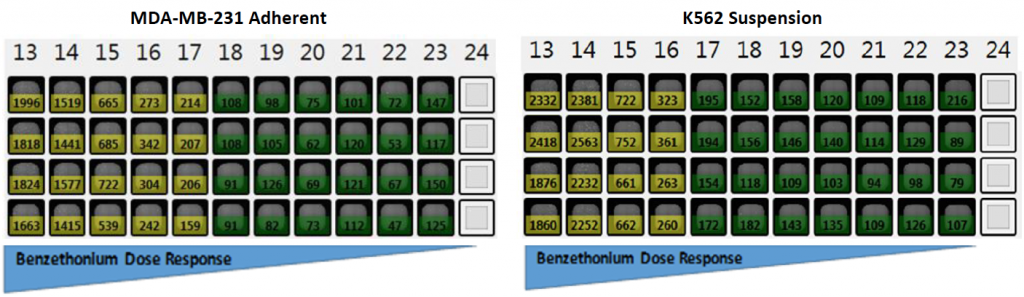
Results for the MDA-MB-31 and K562 counts of dead cells after 24 hours of Benzethonium drug treatment
Graphs
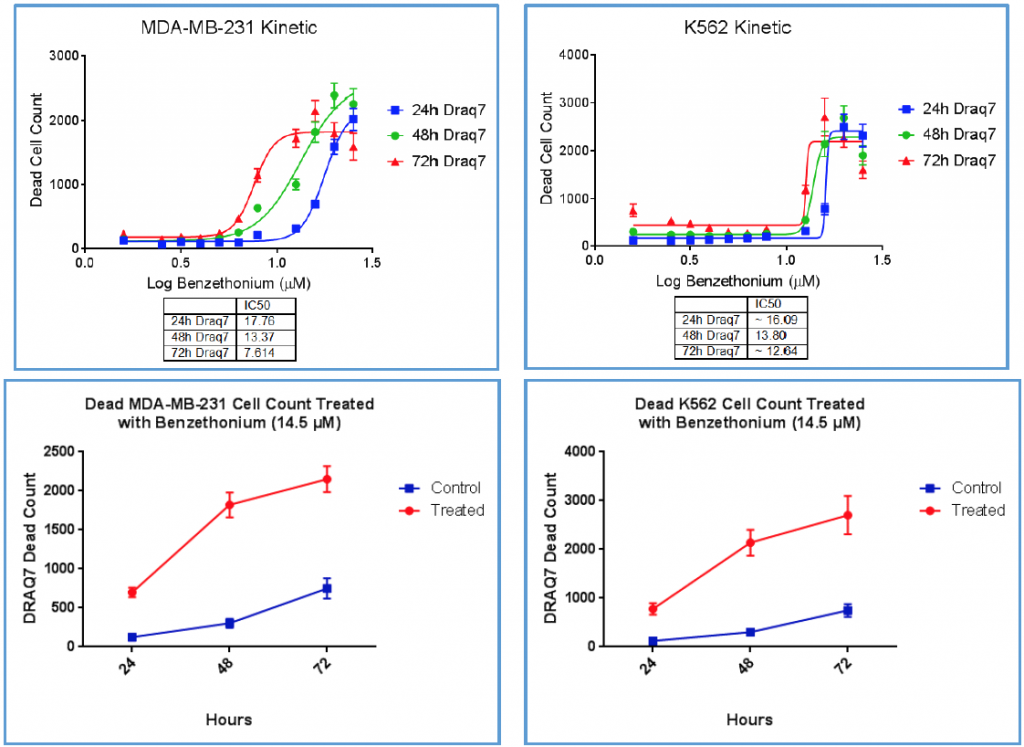
1. Graphs were generated using Graph Pad Prism for the dose-response of Benzethonium after 24, 48 and 72 hours treatment. In this experiment, the average of 4 data points was plotted.
2. IC50 values were calculated using Graph Pad Prism
- Cell death increased over time with Benzethonium (14.5 µM) versus the control
Conclusion
- Drug-treated MDA-MB-231 and K562 cell lines were successfully imaged and analyzed on Celigo
- Kinetic viability assay using DRAQ7 allows for the enumeration of total counts of DRAQ7-positive cells over the time
- Acquisition of high-resolution DRAQ7 and bright field images of 384-well plate took about 15 minutes