| Purpose | To measure the level of receptor internalization induced by known antibody |
| Existing Method(s) | Flow Cytometry |
| Target Cell Type | GFP expressing HT-293 cell line |
| Experiment Plan | Compare receptor internalization level between a positive control antibody and a negative control antibody at different concentrations |
| Hypothesis | Results will show an increase in internalization correlating to increased fluorescent signals from the positive control group. |
Celigo Setup
| Plate Type | Greiner 96-well, black wall clear bottom, Cat # 655090 |
| Scan Channels | Bright field, Red, Green |
| Resolution | 1 µm/pixel |
| Scan Area | Whole well |
| Analysis Method | Target 1 + 2 + Mask |
| Scan Frequency | Hourly, up to 5 hours |
| Scan Time | ~9 min |
Assay Protocol and Plate Setup
Goal:
To measure the level of receptor internalization induced by a known antibody.
Protocol:
Cell preparation
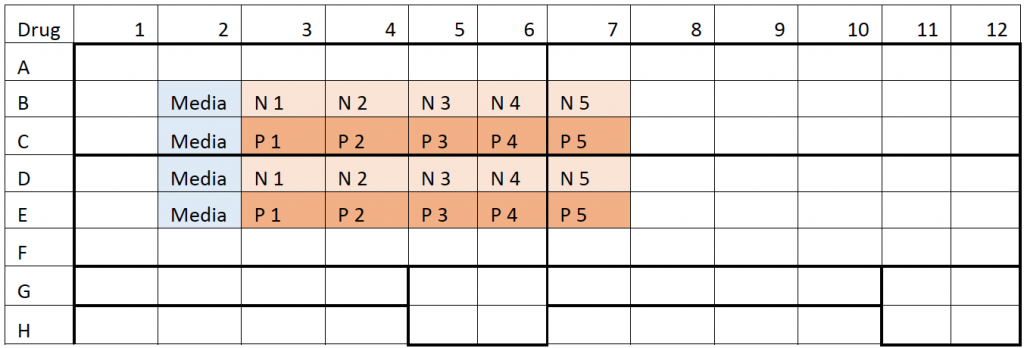
- Collected target cells and seeded at 10,000 cells/well into each well using the plate map below
- Wells labeled with Media are controlled wells with cells and media only
- N1-N5 are a serial dilution of the negative antibody, where N5 is the highest concentration
- P1-P5 are a serial dilution of the positive antibody, where P5 is the highest concentration
- Pipetted the positive and negative antibodies at different concentrations following the plate map below
- The antibodies were pre-labeled with a pH-sensitive dye using a kit from Promega and bind to receptors on the target cells
- The plates were then scanned using the Celigo at T = 0, 1, 2, 3, 4 and 5 hours
Data Collection
- After adding the cells and antibodies, the plate was scanned in Celigo using Target 1 + 2 + Mask application for t = 0 h
- Repeat the scanning for t = 1, 2, 3, 4, and 5 h
Data Analysis
- The images at each time point were analyzed to count the total number of GFP positive cells
- Next, the red fluorescent intensity was measured from within the cells to determine the level of receptor internalization compared to the negative controls
Results
1. Receptor Internalization images using Celigo Imaging Cytometer
- Celigo was used to capture bright field and fluorescent whole-well images on 96-well plates
- It required ~9 min/plate for image acquisition and fluorescent data analysis
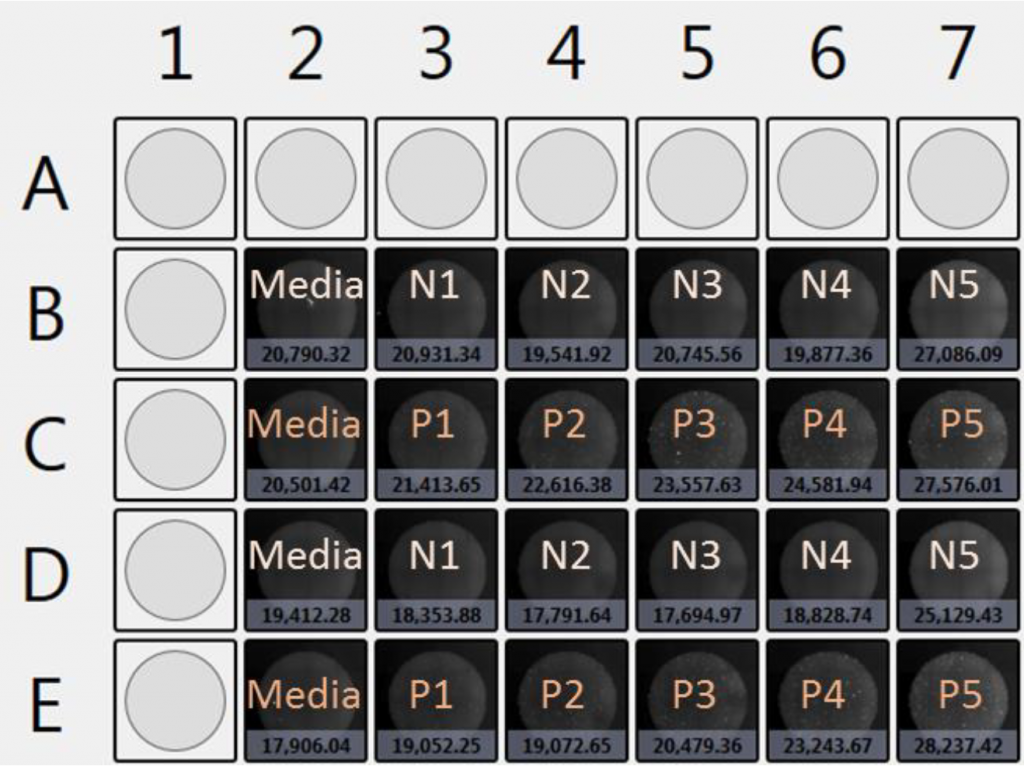
- Whole plate overview can be viewed to quickly assess the receptor internalization results (See figure below)
- In this example, we showed a plate view of HT-293 at 5 hours on the Celigo software to provide a quick at-a-glance result of the receptor internalization
- The values shown in each well are the total or integrated fluorescent intensities
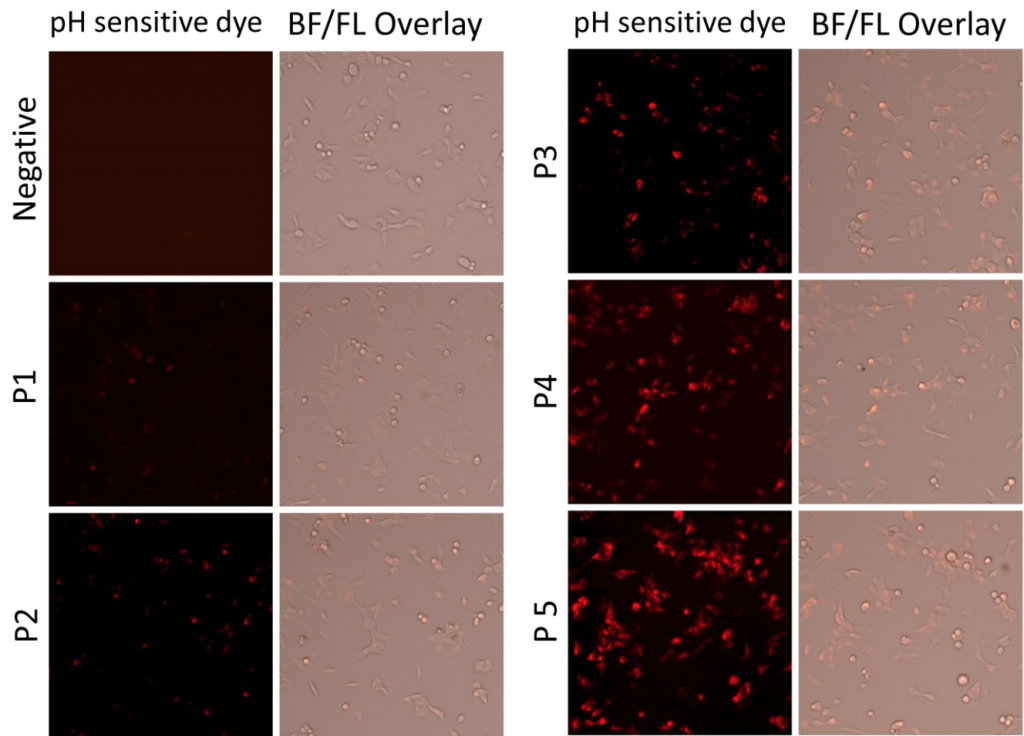
- Each well can be further zoomed-in to view images of individual wells and cell populations in the wells, which allows visual confirmation (See figure below)
- In this example, we showed HT-293, zoomed-in view at 5 hour and different Antibody treatment concentrations
- It is clear that the red fluorescence increased as the concentration of positive antibody increased
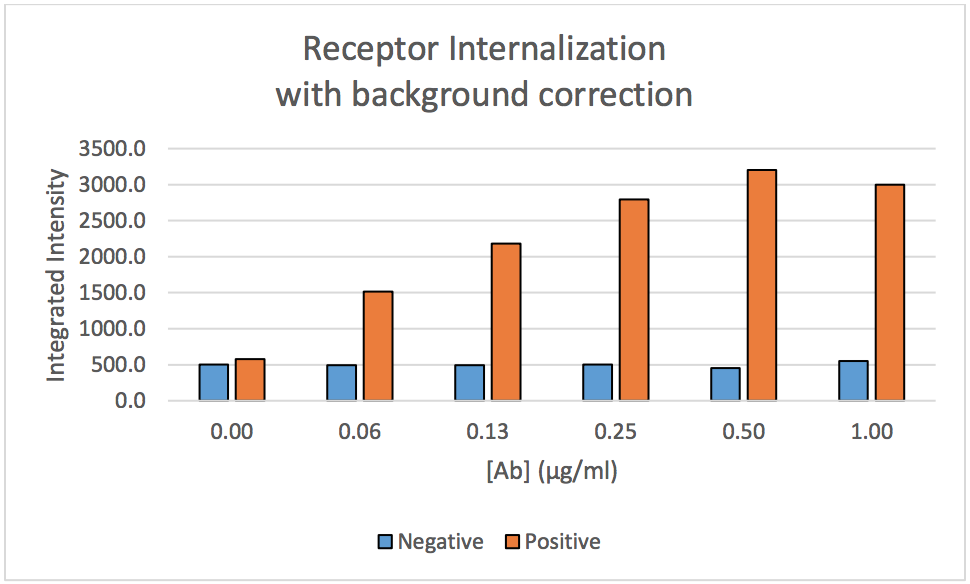
2. Antibody-dependent receptor internalization results
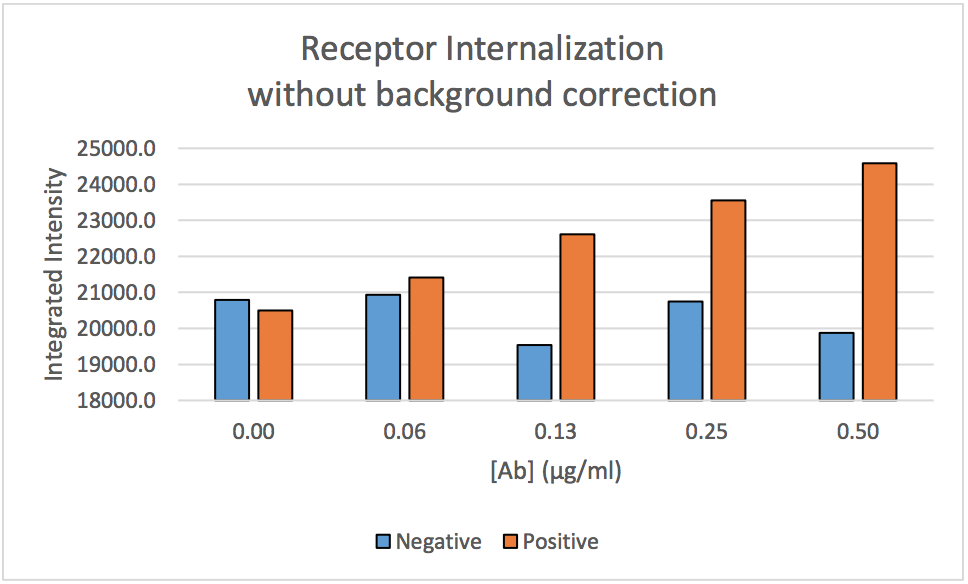
- The receptor internalization analysis measured the total fluorescent intensity in the cell population treated with different Antibody concentrations
- The Negative Antibody showed no fluorescent signals, which was observed in the images as well
- By measuring the total fluorescent intensities in the cells, we saw an increase in signal as the concentration of positive Antibody increased
- In addition, Celigo software was able to perform background correction to improve signal-to-background ratio with resulting data showing below
Conclusion
- The results showed a clear difference between a negative antibody and positive antibody in internalization
- A dose-response was observed for positive antibody by measuring the average total fluorescent intensity
- By using the background correction function on Celigo, the background can be removed to increase the fluorescent intensities