Identifying downstream candidates for targeted molecular therapy
Renal cell carcinoma (RCC) is among the most prevalent cancers worldwide, responsible for approximately 2% of cancer deaths [1]. Clear cell RCC (ccRCC) accounts for 80% of all RCC cases and is notoriously resistant to conventional radiotherapy and chemotherapy treatments. Tumor heterogeneity within individual patients and among patient groups further complicates the development of effective treatment strategies. Presently, there are no approved immunotherapies or targeted molecular therapies for RCC. A fundamental understanding of the molecular mechanisms responsible for the development and progression of RCC will be pivotal in developing next-generation treatment protocols to improve patient outcomes. Recently, Zheng et. al. investigated the role of a known pro-tumorigenic protein, Karyopherin a2 (KPNA2), in kidney tumor development and metastasis. KPNA2 plays a key role in nucleocytoplasmic transport and regulation of DNA damage repair through cell cycle checkpoints [2]. Previous studies also demonstrated increased KPNA2 expression in other malignancies [3]. The present study used a combination of in vitro models and in vivo mouse studies to demonstrate the role of KPNA2 in RCC and identified downstream targets, such as NPM1, regulated by KPNA2 that may be candidates for targeted molecular therapy.
In vitro RCC Experiments
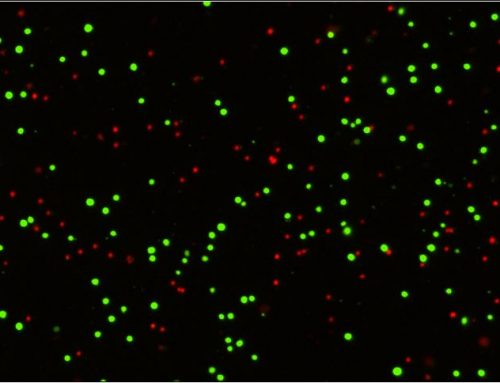
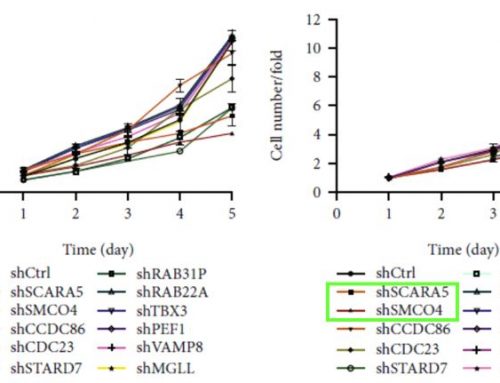
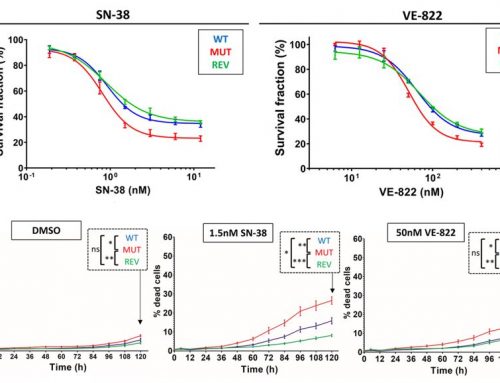
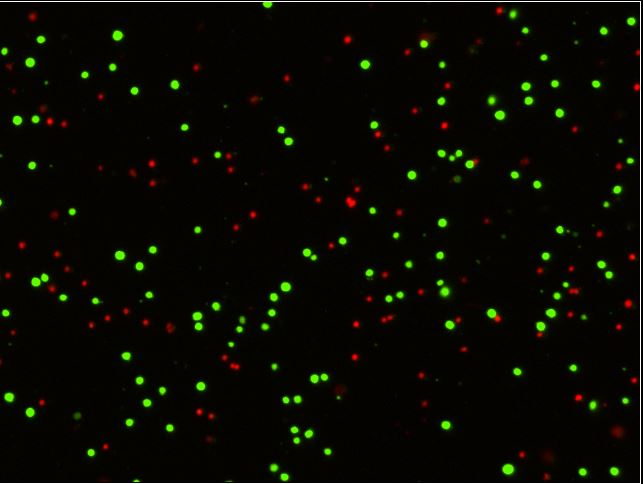
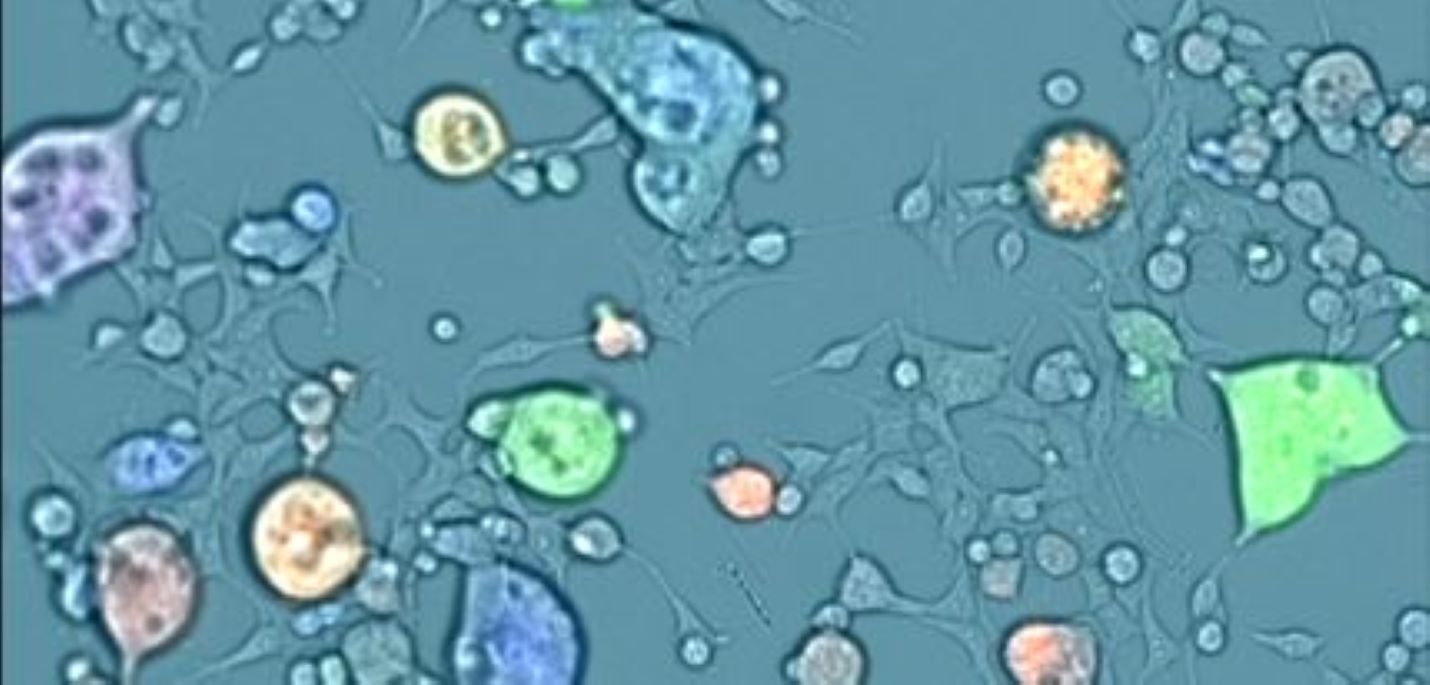
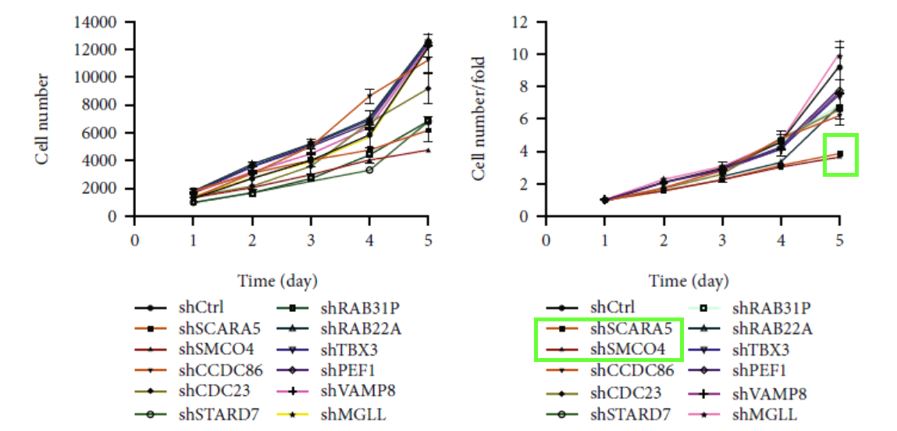
Human RCC cell lines (786-O and ACHN) were infected with lentiviruses expressing short-hairpin RNA (shRNA) to knock down the KPNA2 gene (shKPNA2) and a lentiviral vector without siRNA was used as a negative control (shCtrl). A GFP reporter was used to monitor the transfection efficiency and cells were collected when a positive rate of 70-80% was attained and the confluence percentage was approximately 80%. Cell growth was monitored with the Celigo Image Cytometer (Nexcelom Bioscience) to quantify the impact of the KPNA2 knockdown on cell proliferation. Cells were seeded at multiple concentrations in 96-well plates and imaged daily for five days to determine the growth rate for the knockdown (shKPNA2) and control samples (shCtrl). The cell growth was significantly reduced in the knockdown models of both the 786-O and ACHN cell lines (Figure 1). The cell counts and determination of GFP+ expression were quantified using the integrated Celigo software tools. Additional cell-based assays were performed to help validate the findings and further explore the mechanisms of KPNA2 action (Figure 2). Cell cycle analysis demonstrated that silencing KPNA2 significantly increased the population of cells in the G1 phase and reduced the populations of cells in the S and G2/M phases of the cell cycle when compared to the controls. The knockdown of KPNA2 (shKPNA2) also exhibited heightened apoptotic cell death in the kidney tumor cells based on the flow cytometry analysis.

Figure 1. KPNA2 is essential for kidney tumor cell growth. After knockdown of KPNA2, the cells with GFP fluorescence detected by Celigo significantly decreased in 5 days following after 3 days postinfection in (C) 786-O cells and (E) ACHN cells. The total count of cell and proliferation rate was plotted for (D) 786-O cells and (F) ACHN cells. (Modified from Zheng et. al. J Cell Mol Med 2021)

Figure 2. KPNA2 is essential for kidney tumor cell growth and KPNA2 knockdown promotes the apoptosis rate. (Top) Cell cycle was arrested in the G1, S, and G2/M phase after silencing KNPA2 in ACHN cells. (Bottom) The percentage of apoptotic cells in ACHN cells infected with lentiviruses expressing either shCtrl or shKPNA2 (***p<0.001)
Co-immunoprecipitation mass spectrometry (Co-IP/MS) was also performed to screen the protein interactions with KPNA2 to help identify downstream molecules as potential diagnostic biomarkers or therapeutic targets. Immunofluorescence (IF) staining demonstrated a high degree of colocalization between KPNA2 and the phosphoprotein NPM1, which has been implicated in cell proliferation, migration, and invasion across multiple types of solid tumors in humans.
In vivo RCC Experiments
The ACHN cells with the KPNA2 knockdown (shKPNA2) and the negative control (shCtrl) were introduced into a BALB/c mouse model to demonstrate the oncogenic activity of KPNA2 in vivo. The cells were injected into each subject and imaged once a week over seven weeks to measure tumor growth rate. The measured tumor volume and endpoint tumor weights were significantly reduced in the knockdown model. Silencing KPNA2 in the in vivo model demonstrated a significant reduction in the development of metastasis compared to the negative control group (Figure 3).

Figure 3. Silencing KPNA2 reduced the development of ccRCC in vivo. Bioluminescence imaging was performed in mice after infection with ACHN cells expressing shKPNA2 (KD) or shCtrl (NC) in the following seven weeks. (A) Bioluminescence imaging was performed in control mice (NC). (B) Bioluminescence imaging was performed in KPNA2 knockdown mice (KD). (Tumour volumes (D) and tumour weight (E) of subcutaneous injection models of KPNA-silencing and control mice are shown. (Modified from Zheng et. al. J Cell Mol Med 2021)
The imaging and quantification of the RCC cell culture models on the Celigo Image Cytometer, along with the characterization of potential molecular targets that interact with KPNA2, showcased a method to identify and screen candidate therapies for a certain type of cancer that are resistant to traditional chemotherapy and radiotherapy, like ccRCC. It is worth noting that the Celigo system is also capable of performing the supporting cell-based assays that were demonstrated in this study (apoptosis, migration, wound-healing, and cell cycle analysis). The identification of molecular targets is a critical stage in developing effective new therapeutics or high-throughput screening of candidate molecules. These stages of development are routinely performed on the Celigo platform to leverage the rapid screening capabilities and integrated software analysis tools all in a convenient benchtop instrument. The optional 21 CFR Part 11 software also facilitates compliance with regulatory documentation requirements.
The Celigo Image Cytometer offers a wide variety of applications for automated cell counting and cell-based assays with intuitive software analysis tools and automation options to accommodate high-throughput needs. Learn more about cellular models and direct cell counting assays on our Celigo Image Cytometer Applications page or contact us directly to book a seminar or live demonstration today.
References
- Hsieh JJ, Purdue MP, Signoretti S, et al. Renal cell carcinoma. Nat Rev Dis Primers. 2017;3:17009.
- Teng S-C, Wu K-J, Tseng S-F et al. Importin KPNA2, NBS1, DNA repair and tumorigenesis. J Mol Histol. 2006;37(5–7): 293-299.
- Altan B, Yokobori T, Mochiki E et al. Nuclear karyopherin-α2 expression in primary lesions and metastatic lymph nodes was associated with poor prognosis and progression in gastric cancer. Carcinogenesis. 2013;34(10):2314-2321.
- Zheng, Song et al. “KPNA2 promotes renal cell carcinoma proliferation and metastasis via NPM.” Journal of cellular and molecular medicine vol. 25,19 (2021): 9255-9267. doi:10.1111/jcmm.16846
Leave A Comment