Advancing in vivo studies using 3D tumor models
Cells are traditionally cultured and assayed as two-dimensional (2D) monolayers on flat surfaces. This method lacks the cell-to-cell interaction and complex structure that typically form in patients, which may not accurately represent in vivo conditions. Three-dimensional (3D) cell cultures may be more closely resemble in vivo situations in terms of physiological functions, gene expression profiles, signaling, and responses to treatment.
A study at the Institute of Cancer Research (Box et al, 2013) emphasizes the relevance of 3D models in preclinical drug screening and development by illustrating how a 3D in vitro model produced much more comparable results to in vivo studies than a 2D in vitro model originally predicted.

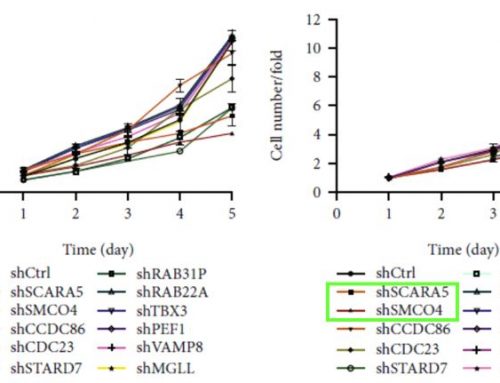
Figure 1: Cell line variants, selected for sensitivity (S) or resistance (R) to gefitinib, cultured both in vitro and in vivo. The cells were assessed for proliferation in vitro in 2D and 3D, as well as in vivo in 3D. The in vitro 3D graph illustrates mimics the in vivo experiment closely. (Box et al, 2013)
Simplification of 3D screening
Automated imaging and quantitative analysis of the entirety of each spheroid in every well of a 96- or 384-well of ultra-low attachment (ULA) plate can be simultaneously performed with the Celigo Image Cytometer in 5-10 minutes, eliminating the need for additional image analysis software.
The Celigo automatically captures spheroid images in brightfield while simultaneously quantifying the area using advanced texture algorithms. This analysis can assess spheroid growth and quantify the invasion area over several days in response to drug treatments.

- suspension culture
- single tumor spheroid/well
- reproducible sized spheroids


Figure 2: (a) Single-spheroid suspension cultures were created in each well of Nexcelom ultra-low attachment 96-well round-bottomed plates. (b) Fully automated simultaneous imaging and analysis were performed using the Colony Counting Embryoid Body application on the Celigo high-throughput image cytometer. Scale bar: 500 μm. (c) The instrument provides a tumor spheroid growth curve as well as (d) frequency plots of four-day spheroid volume across a plate (Vinci et al, 2012).
In-depth scalable data
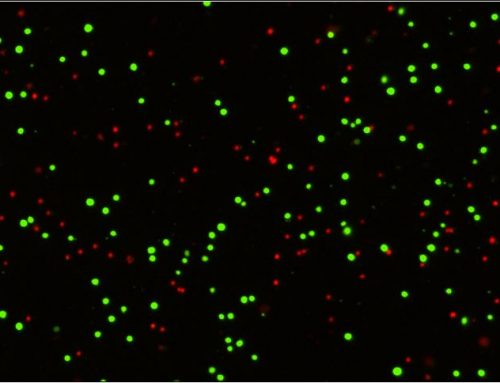
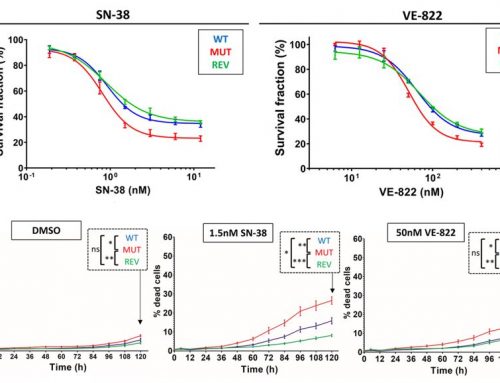
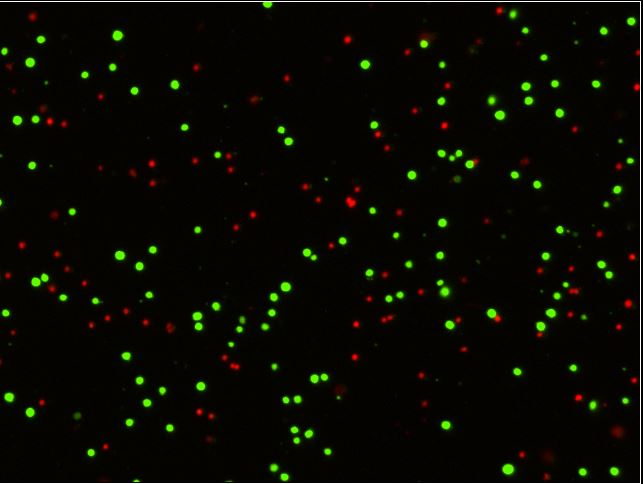
Spheroid health assessments and other multi-parametric information are attainable through the use of membrane-impermeable nuclear viability dyes like propidium iodide. These dyes are only able to enter cells with compromised membranes, providing information regarding the number of dead cells in culture (Figure 4a, Shen, et al, 2017).


A standardized method high-throughput imaging and analysis of tumor spheroids
In terms of gene expression, responses to treatment, and other characteristics, 3D culture more closely resembles the in vivo characteristics of cancer compared to 2D monolayers. Using the Celigo image cytometer, thousands of spheroids or PDOs can be imaged in brightfield and/or fluorescence to quickly generate quantitative data for multiple experimental conditions in around 10-15 minutes.
Celigo performs simultaneous imaging and analysis to rapidly capture and quantify spheroid images in every well with advanced software segmentation. This advanced system coupled with easy-to-use, add, and read fluorescence reagents enables rapid multi-parametric information regarding, proliferation, viability, and cell death pathways. Learn more about 3D phenotypic cellular models and the direct cell counting assays for Immunotherapy and Virology on our website. Contact us for more information at sales@nexcelom.com or schedule a demonstration.
References
- Box, C., Mendiola, M., Gowan, S., Box, G. M., Valenti, M., Brandon, A., Al-Lazikani, B., Rogers, S. J., Wilkins, A., Harrington, K. J., & Eccles, S. A. (2013). A novel serum protein signature associated with resistance to epidermal growth factor receptor tyrosine kinase inhibitors in head and neck squamous cell carcinoma. European journal of cancer (Oxford, England: 1990), 49(11), 2512–2521. https://doi.org/10.1016/j.ejca.2013.03.011
- Shen, M., Asawa, R., Zhang, Y. Q., Cunningham, E., Sun, H., Tropsha, A., Janzen, W. P., Muratov, E. N., Capuzzi, S. J., Farag, S., Jadhav, A., Blatt, J., Simeonov, A., & Martinez, N. J. (2017). Quantitative high-throughput phenotypic screening of pediatric cancer cell lines identifies multiple opportunities for drug repurposing. Oncotarget, 9(4), 4758–4772. https://doi.org/10.18632/oncotarget.23462
- Kessel, S., Cribbes, S., Bonasu, S., Qiu, J., & Chan, L. L. (2018). Real-Time Apoptosis and Viability High-Throughput Screening of 3D Multicellular Tumor Spheroids Using the Celigo Image Cytometer. SLAS discovery: advancing life sciences R & D, 23(2), 202–210. https://doi.org/10.1177/2472555217731076
- Kessel, S. L., & Chan, L. L. (2020). A High-Throughput Image Cytometry Method for the Formation, Morphometric, and Viability Analysis of Drug-Treated Mammospheres. SLAS discovery: advancing life sciences R & D, 25(7), 723–733. https://doi.org/10.1177/2472555220922817
Leave A Comment